What can traffic data tell us about the impact of the coronavirus?
&w=256&q=90)
The way we move has seen a radical change in the first months of 2020, as citizens across the world stay at home to flatten the curve. What can location data tell us about these emerging traffic patterns?
At the best of times, the average family car is only ever in use for 4% of its working life. The rest of the time it sits in the garage, on the drive, or parked next to the office. Today, however, it is lucky to get even a cursory weekend run out to the supermarket. We are living in extraordinary times, the age of the coronavirus.
How have traffic patterns changed across the world as a result of the spread of the coronavirus?
The live TomTom Traffic Index shows the extent of traffic congestion around the world. It will also tell you that, in 2019, the average extra time spent in traffic was 87 minutes. In 2020, this number might look different. With COVID-19 imposing a heavy burden on society, many countries have reacted by restricting public movement.
In many of our cities, for the first time in years, roads are traffic-free. Vehicles have all but disappeared from some of the busiest cities in the world. Those that are making car journeys are finding their trip times are much shorter than normal. These patterns are a fascinating snapshot into the impact that COVID-19 has had across the world, and how countries are reacting to the threat.
What can traffic data do?
Working from home has become mandatory for many. Non-essential shops and public places have been closed. Factories and offices are in lockdown. As the infection numbers are mounting and the health care system is facing a difficult test an obvious question arises: Do these measures work?
At TomTom, we are no epidemiologists, and the clinical spread of infectious diseases is not our specialty. We are, however, data geeks with access to a treasure chest of location data. This information provides crucial insights into how cities are reacting to these new measures and can help authorities and organizations make informed mobility decisions.
Let’s take a look at a city where social distancing rules are in effect.
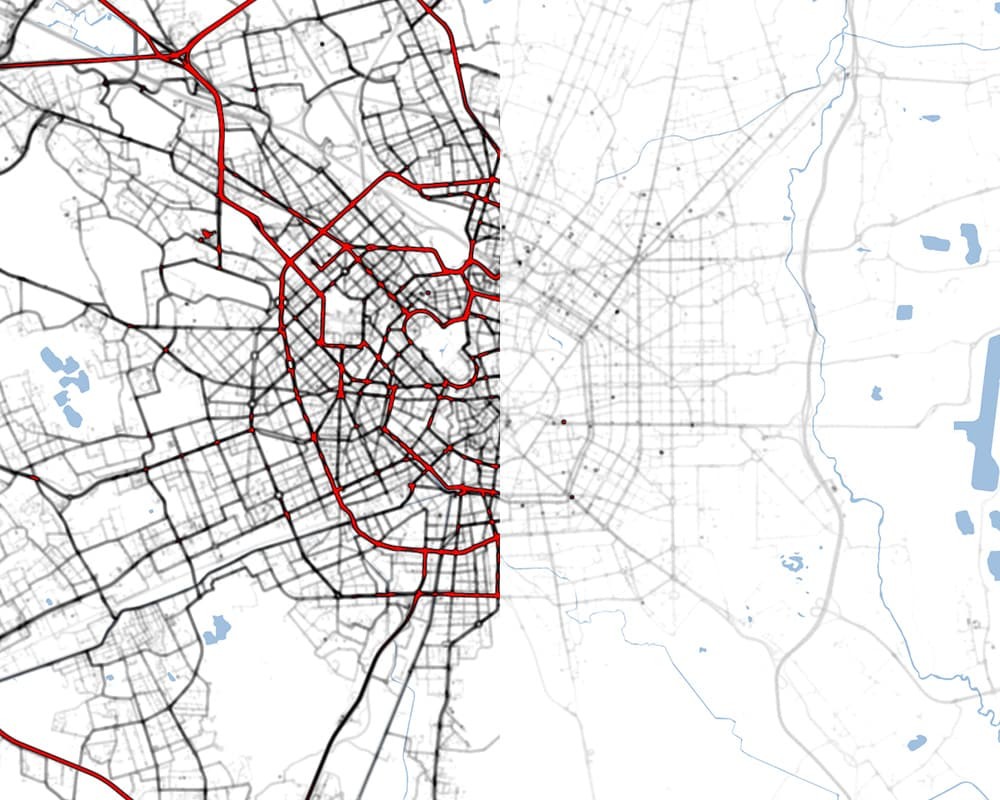
We can observe the usual movements around the city of Milan (fig. 1). In the images below the only underlying map data are the water elements. All the lines are GPS traces connected to TomTom devices collected on January 24. We can compare this to a more recent view taken on April 6 (fig. 2) and it’s startling to see the reduced amount of traffic in the city. This visually shows that people are not moving in the usual way, opting to follow official guidelines and stay at home.
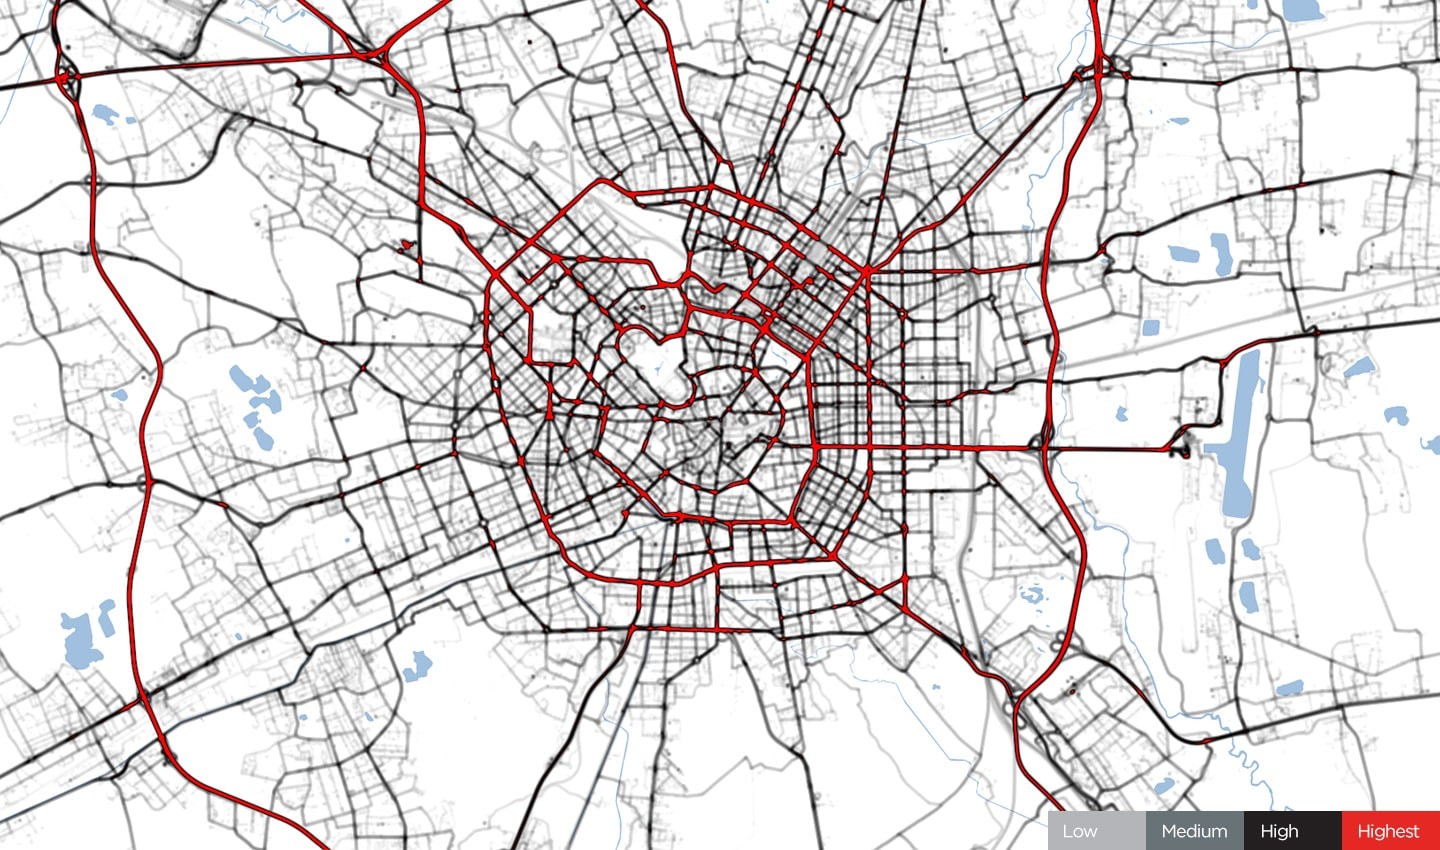 Fig. 1 – Milan, January 24, 2020. Before COVID-19 restrictions.
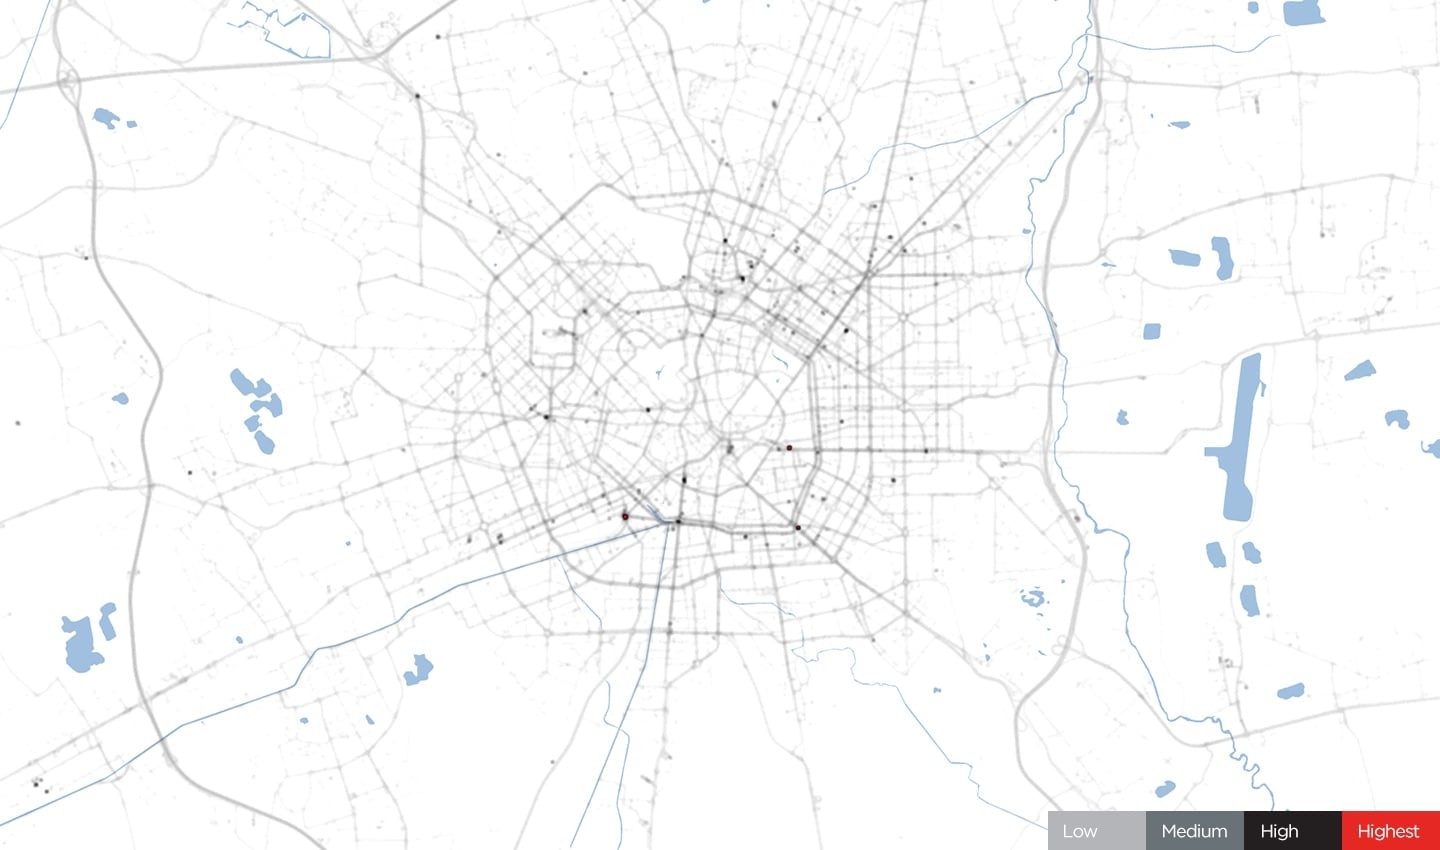 Fig. 2 – Milan, April 6, 2020. During COVID-19 restrictions.
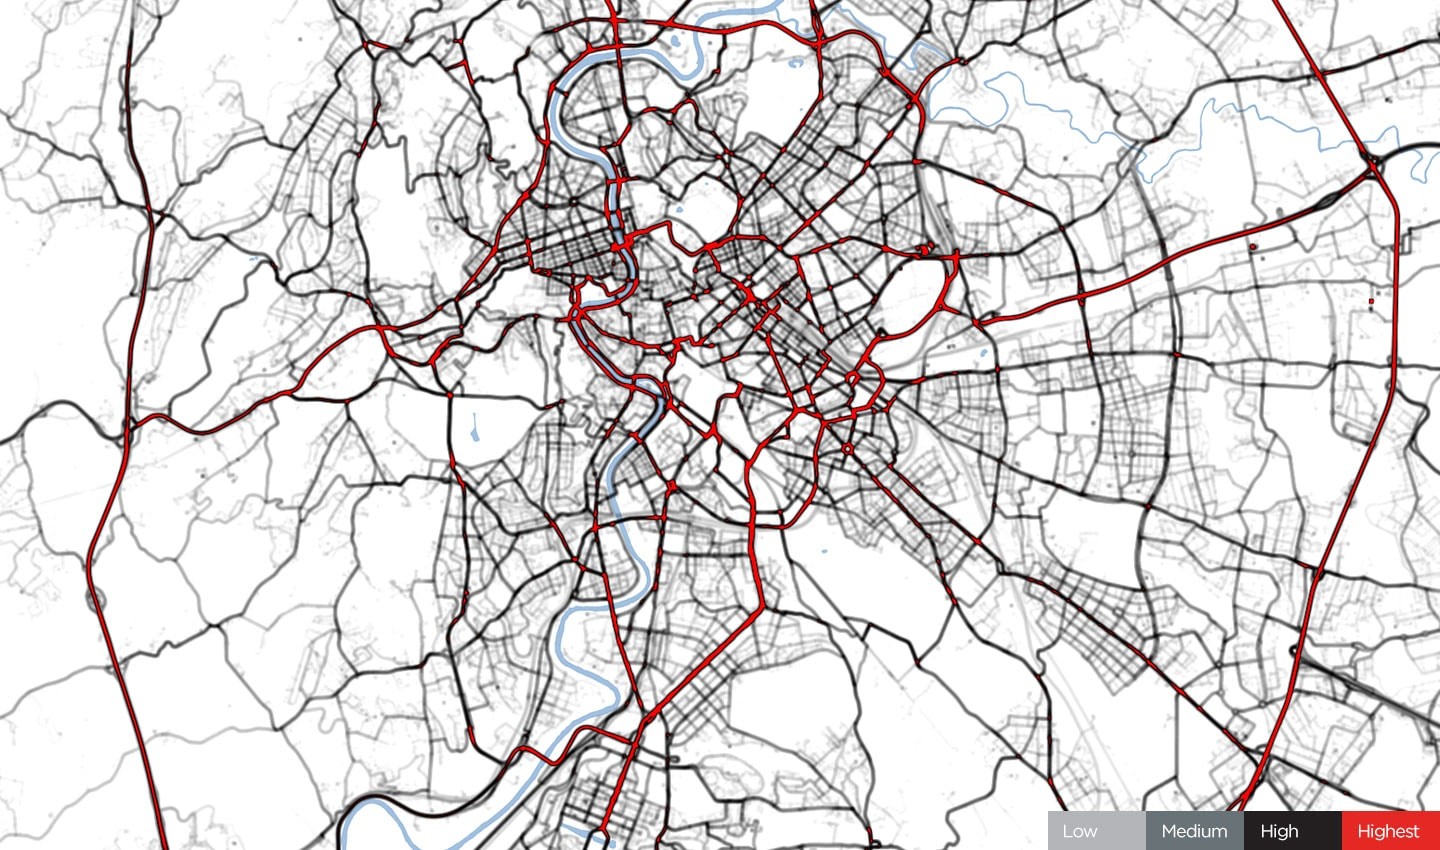 Fig. 3 – Rome, January 24, 2020. Before COVID-19 restrictions.
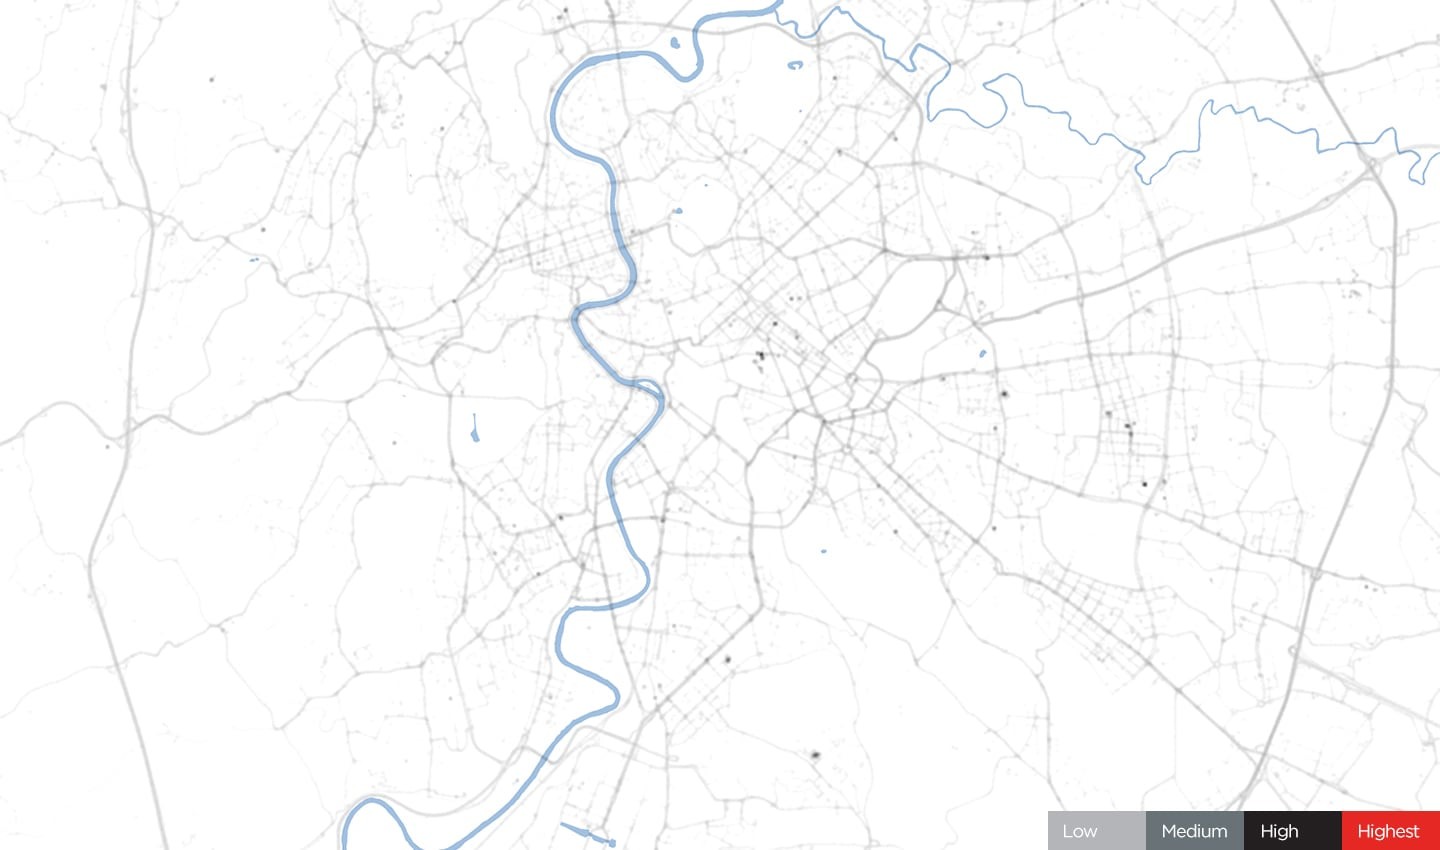 Fig. 4 – Rome, April 6, 2020. During COVID-19 restrictions.Using this data, we can calculate that on average traffic is around 85% lower than would be expected in Milan and Rome.
Italy is not alone in this experience, many countries see similar restrictions on everyday movement, with all but essential travel prohibited.
The US was a little later to feel the effect of the virus and its response has varied across states. California has one of the lowest rates of infection in the country, but we can still see a significant impact on the levels of traffic on the roads. In the city of Los Angeles, traffic has seen a reduction of 67%, while in San Francisco this is around 75%.
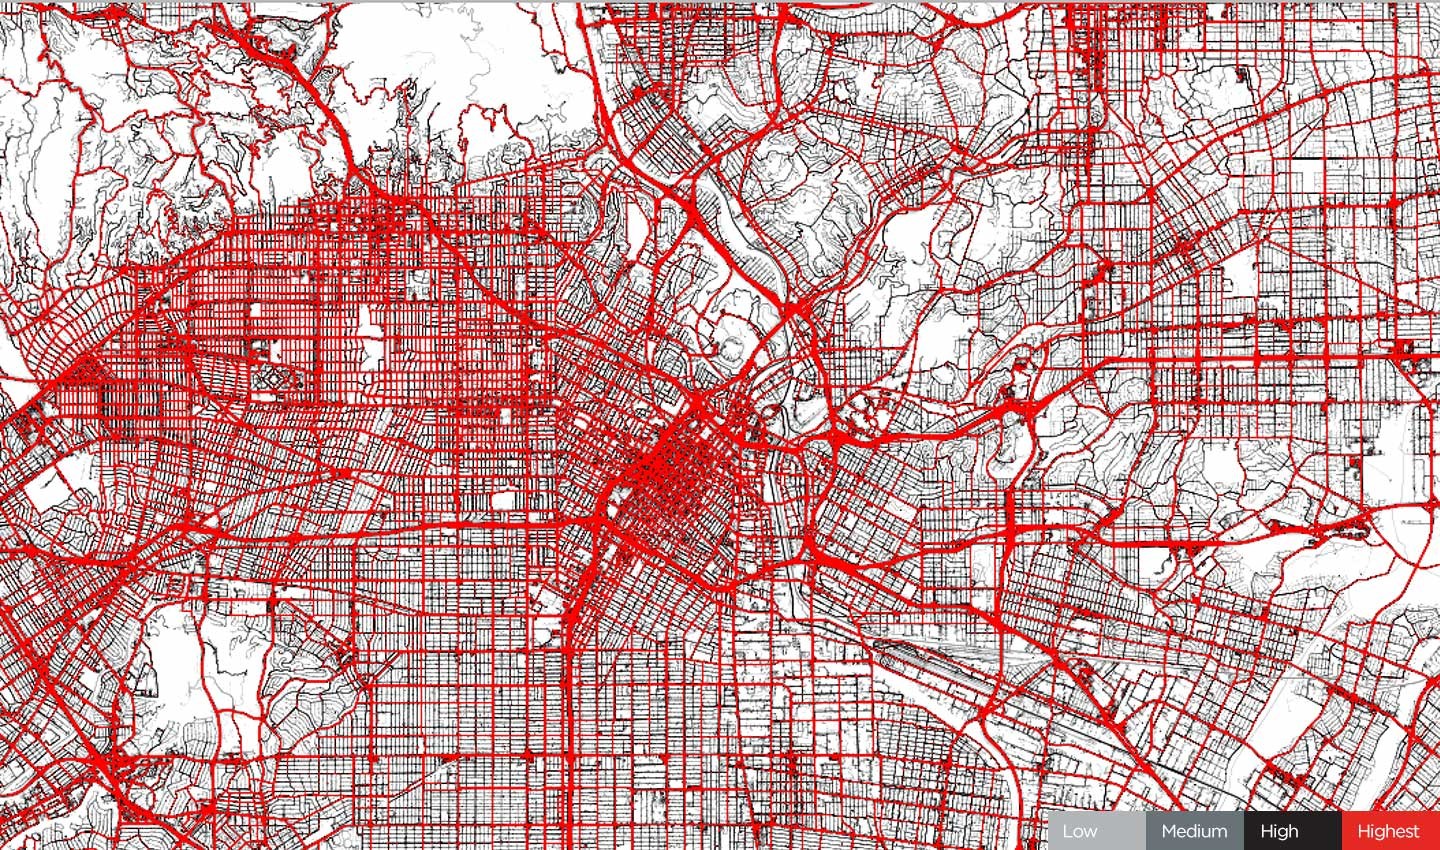 Fig. 5 – Los Angeles, January 24, 2020. Before COVID-19 restrictions.
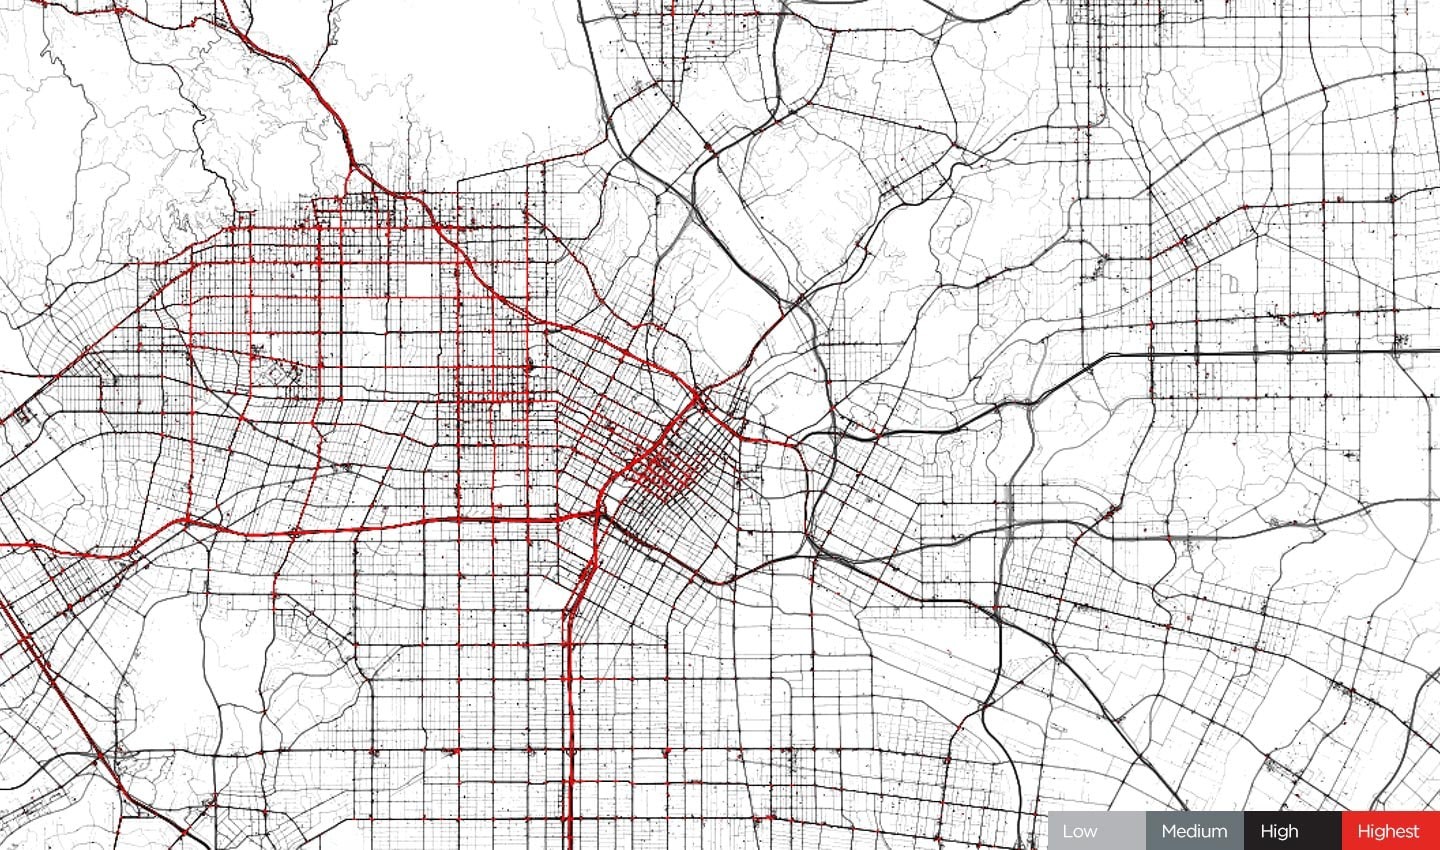 Fig. 6 – Los Angeles, April 6, 2020. During COVID-19 restrictions.
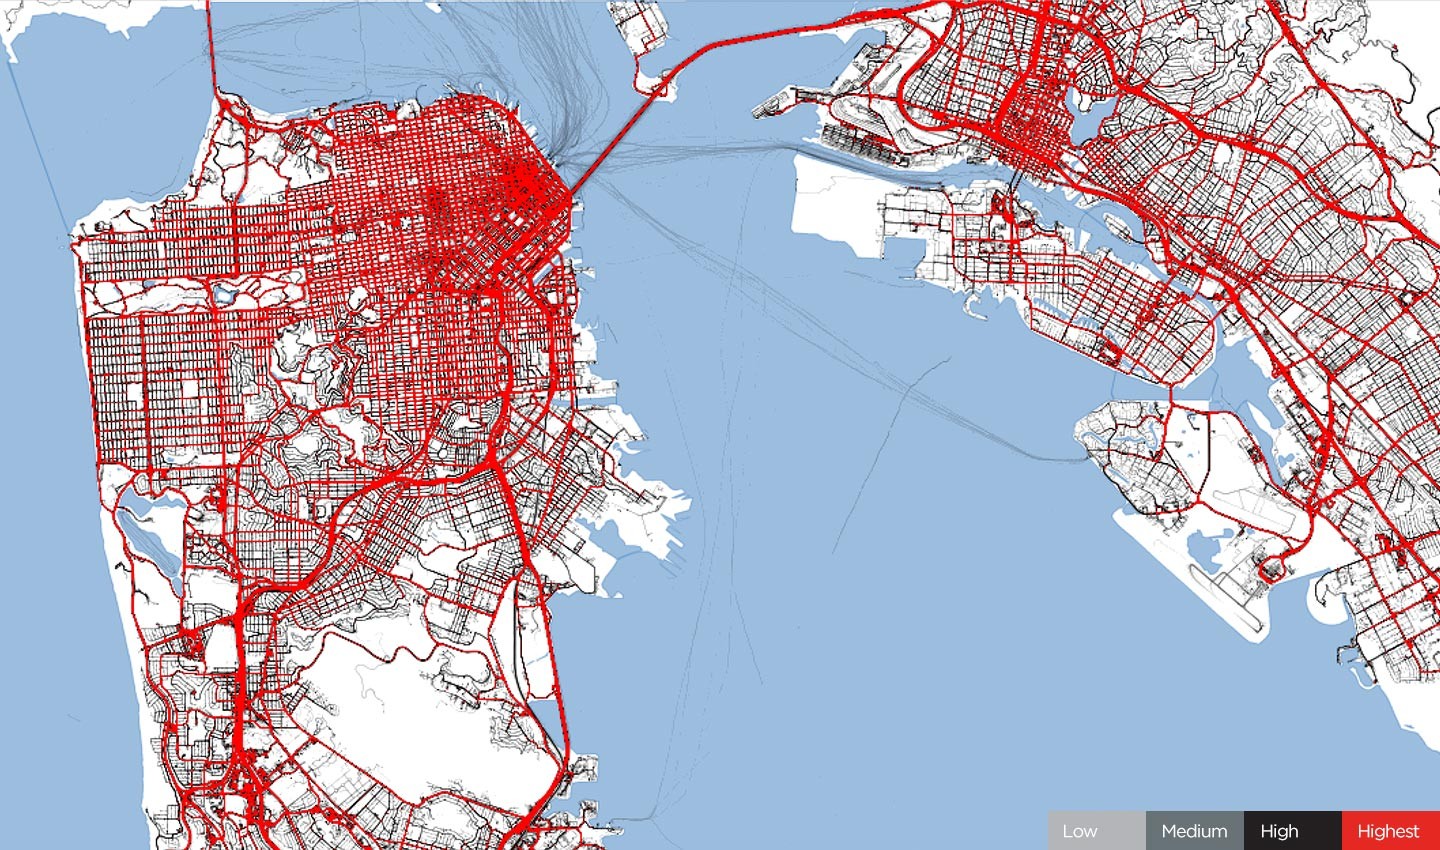 Fig. 7 – San Francisco, January 24, 2020. Before COVID-19 restrictions.
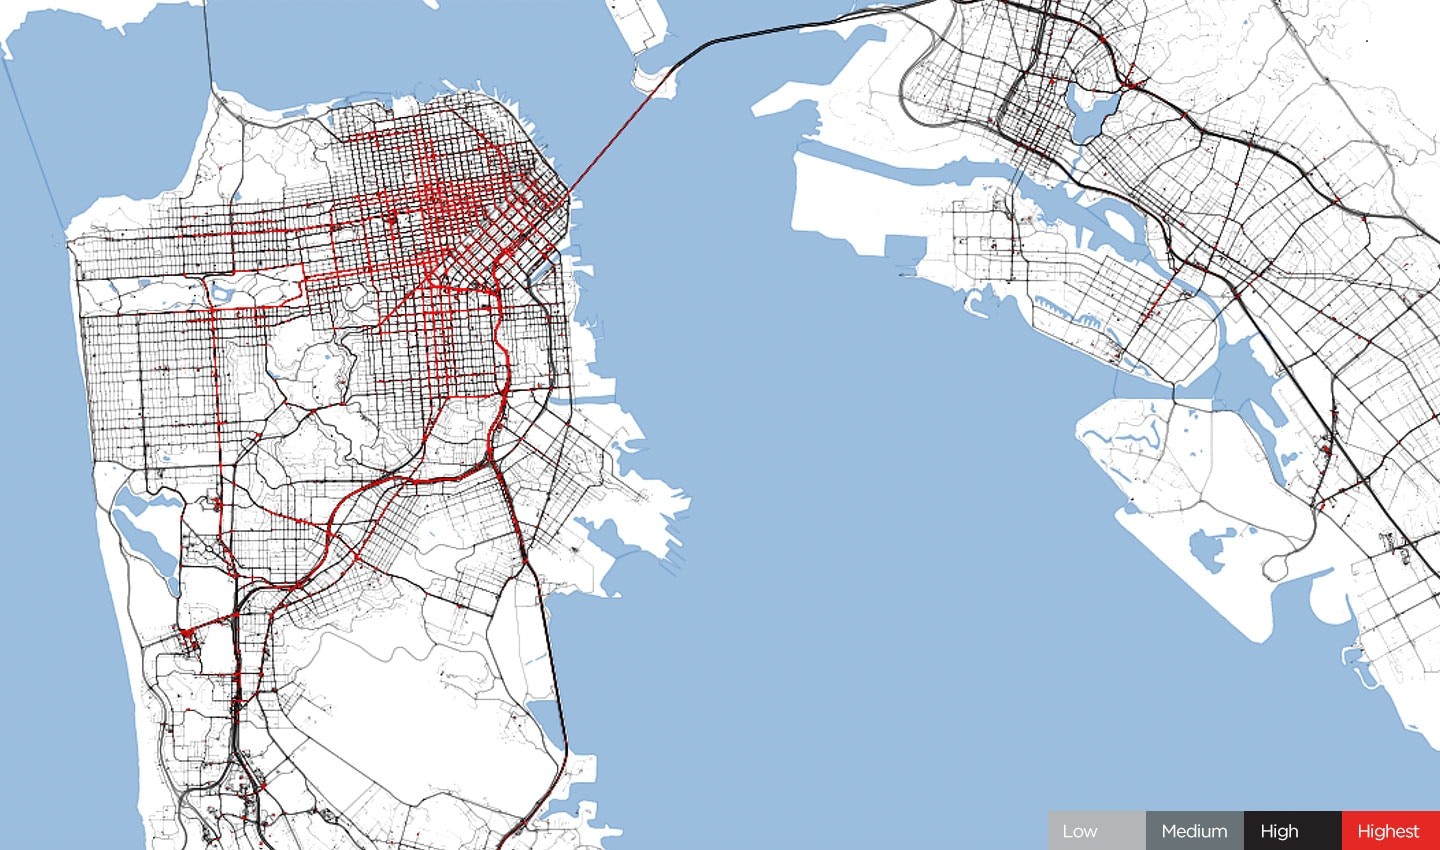 Fig. 8 – San Francisco, April 6, 2020. During COVID-19 restrictions.
What went into this analysis?
For this particular analysis we asked ourselves the following questions: Do we see an overall reduction of mobility following COVID-19 restrictions? If yes, how strong was the reduction? How quickly did people comply?
The data is taken over a 24-hour period to give a correlation of traffic flows in a one-day snapshot. We chose Friday, January 24 as a baseline, as it was before COVID-19 restrictions, but close enough to today’s situation. For the view during COVID-19 restrictions we chose Friday, April 6, so mobility trends were not impacted by the Easter period.
Top ten worldwide cities
Cities around the world, without exception, have seen a sharp reduction in traffic volumes, some by almost 85%. This demonstrates the willingness of people to restrict their movements to contain the spread of the coronavirus. While some traffic movements are still essential – to stock supermarket shelves and for key workers to get to hospitals – many journeys that are deemed unnecessary have been curbed.
To see the scale of the change in mobility patterns across the world, we performed an analysis of the top ten cities in the world with the highest traffic reduction. Using the average traffic figures from the week of January 20 as a baseline, we compared these to the ones from the week of March 30. Taking Milan as an example, this means that the average traffic in the city was 84.78% lower than what you would expect to see in a normal week.
The top ten cities in the world for traffic reduction include:
1. Milan, Italy – 84.78%
2. Paris, France – 84.10%
3. Rome, Italy – 83.80%
4. Madrid, Spain – 83.27%
5. Monaco, Monaco – 79.44%
6. Barcelona, Spain – 81.04%
7. Manchester, UK – 75.65%
8. Lisbon, Portugal – 75.54%
9. Lyon, France – 73.66%
10. Boston, USA – 73.40%
Other significant cities just outside the top 10 include Birmingham, UK (71.89%), London, UK (71.37%), Sao Paulo, Brazil (70.17%), New York, USA (69.96%), and Moscow, Russia (65.44%).
A full breakdown of some of our latest traffic stats can be found here.
Easter weekend
With bank holidays and sunny weather tempting people to enjoy the great outdoors in the Northern Hemisphere, can traffic data indicate how much citizens respect restrictions on movement?
Using the UK as an example, we looked at traffic data over the Easter weekend. The data suggests that between April 10 and April 12, the British respected social distancing guidelines and, despite good weather conditions, stayed at home instead of taking to parks and coastal locations.
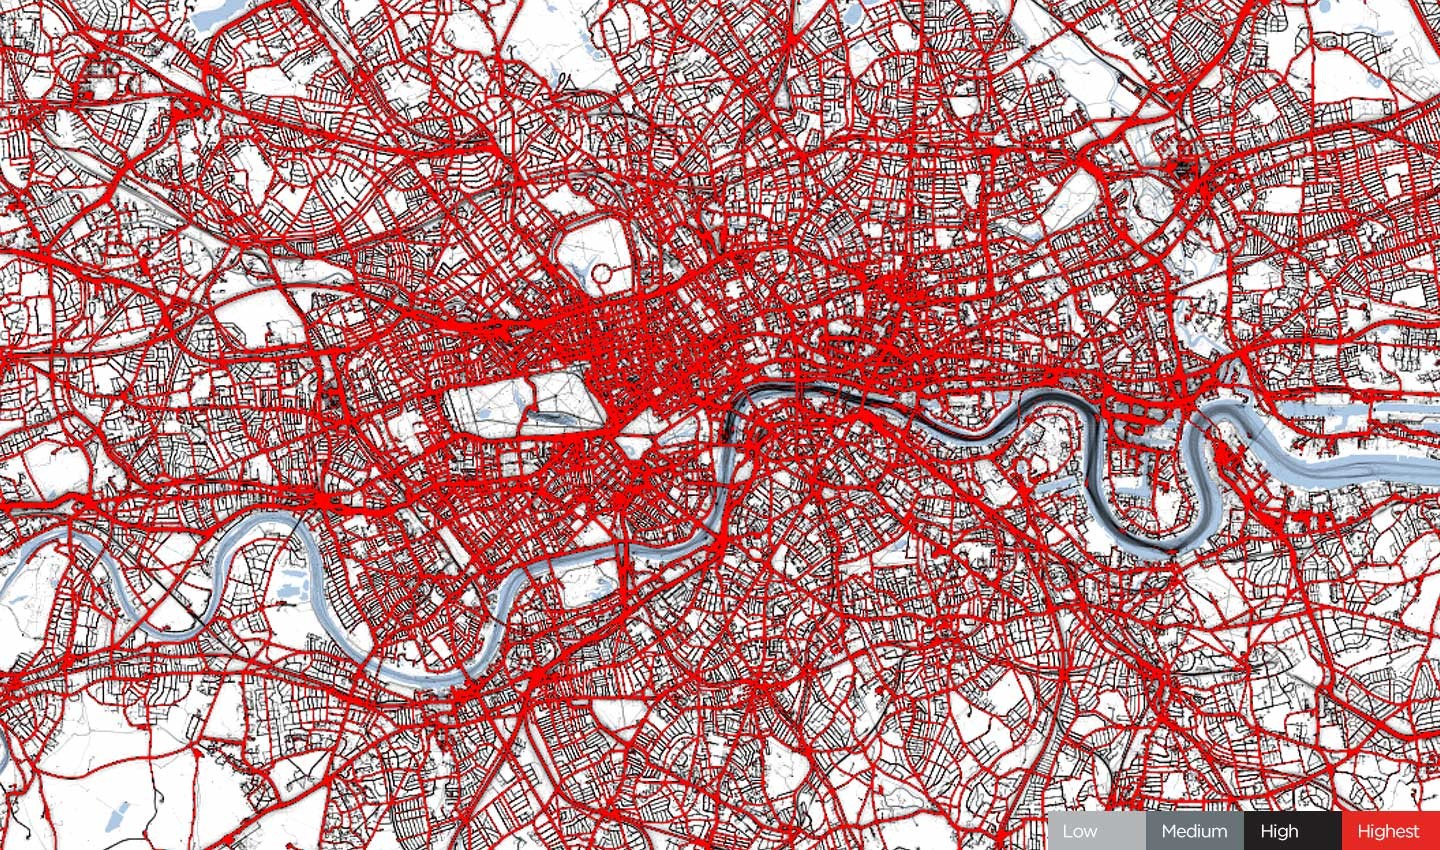 Fig. 9 – London, Easter weekend 2019.
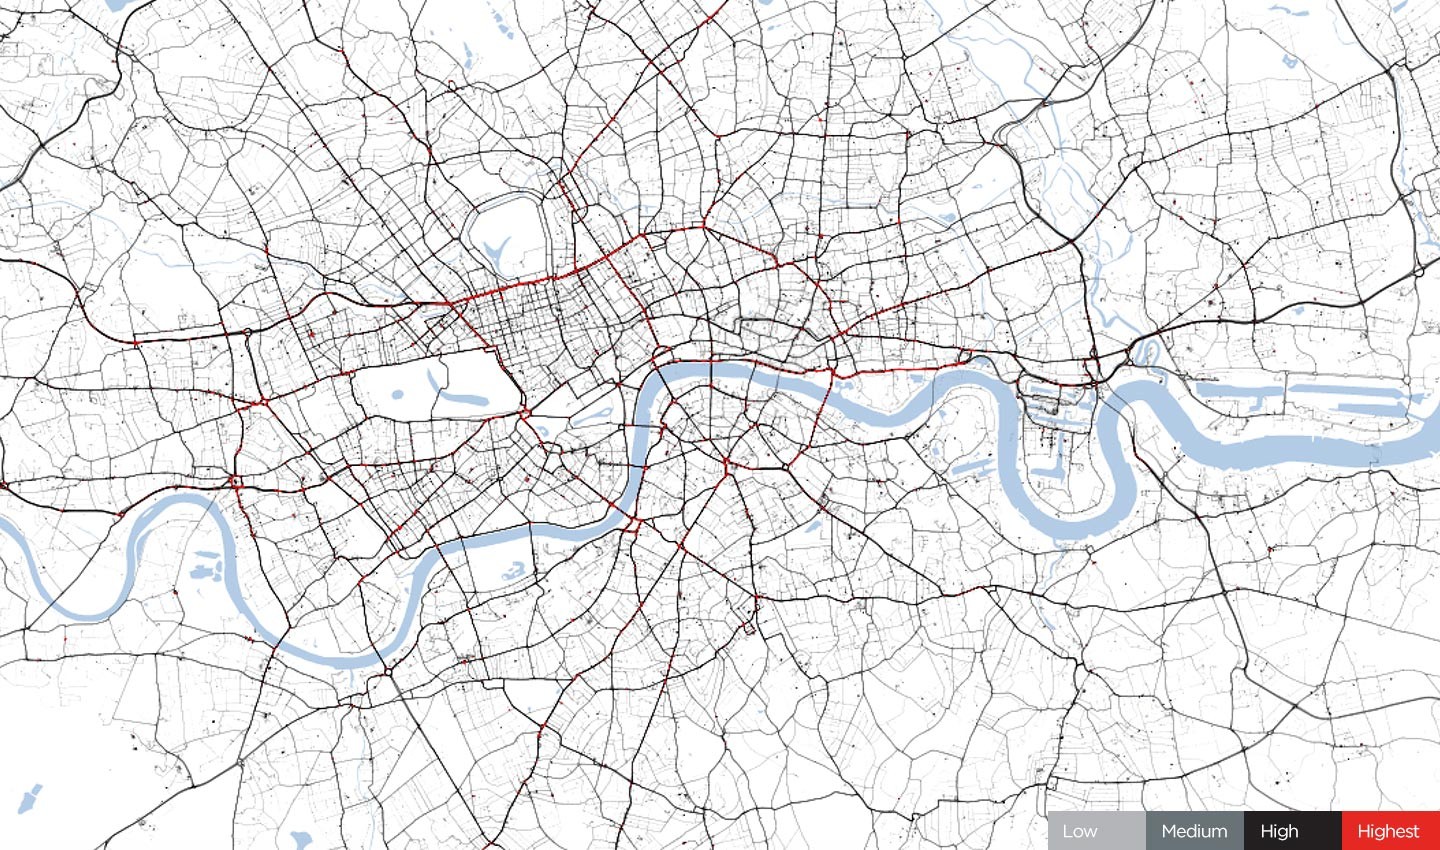 Fig. 10 – London, Easter weekend 2020.
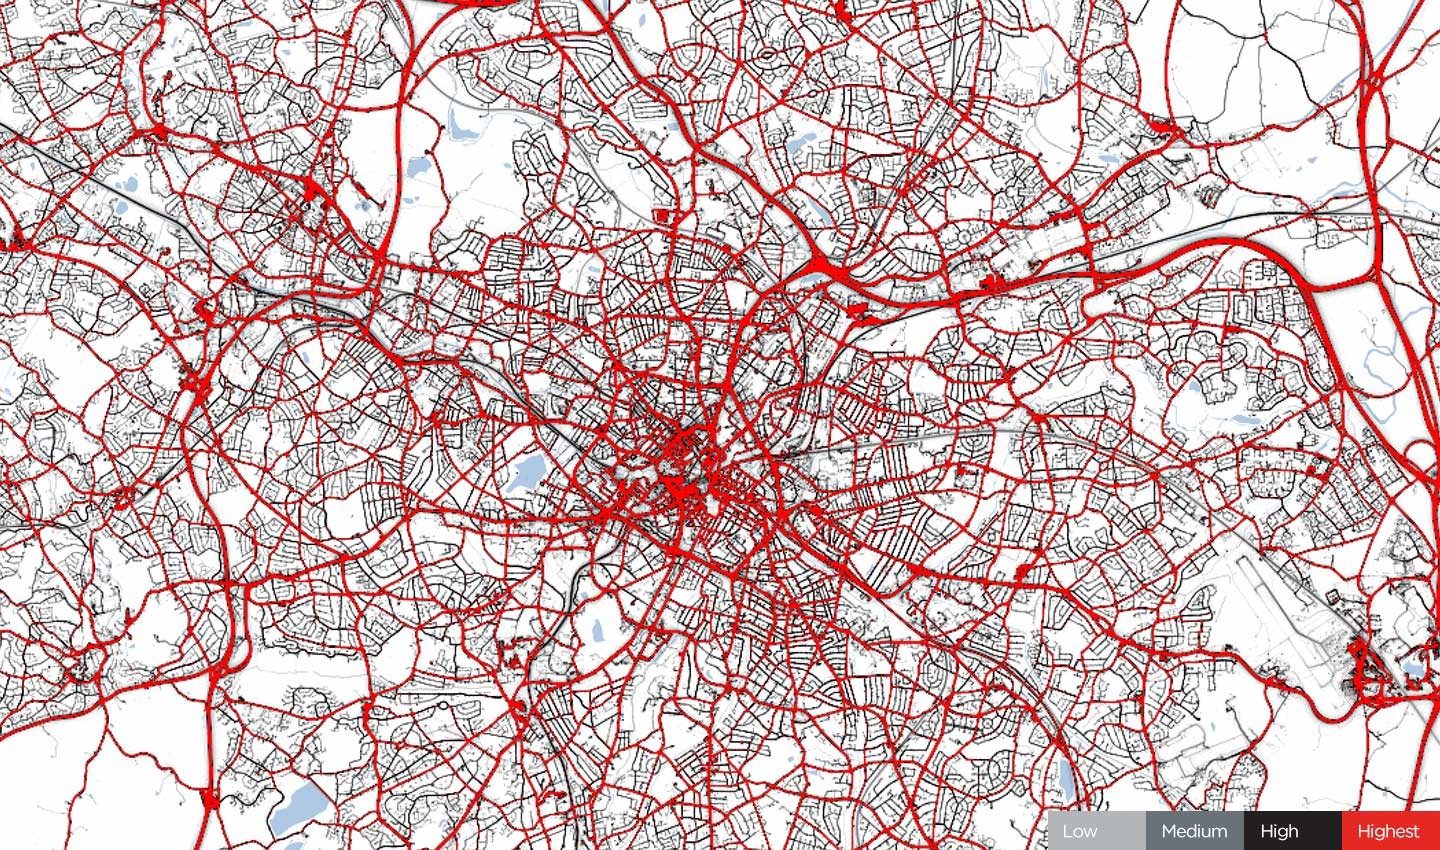 Fig. 11 – Birmingham, Easter weekend 2019.
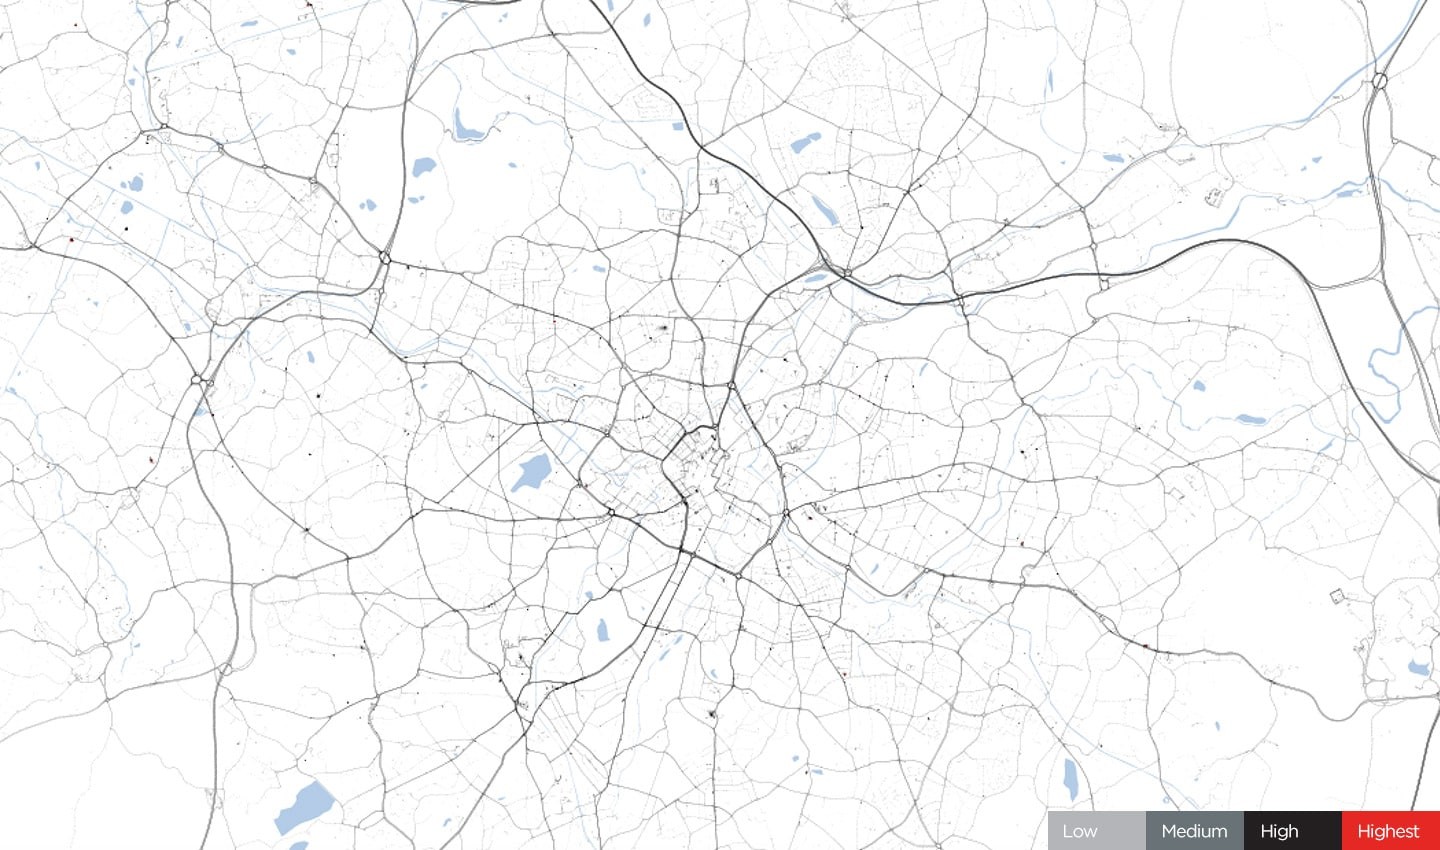 Fig. 12 – Birmingham, Easter weekend 2020.
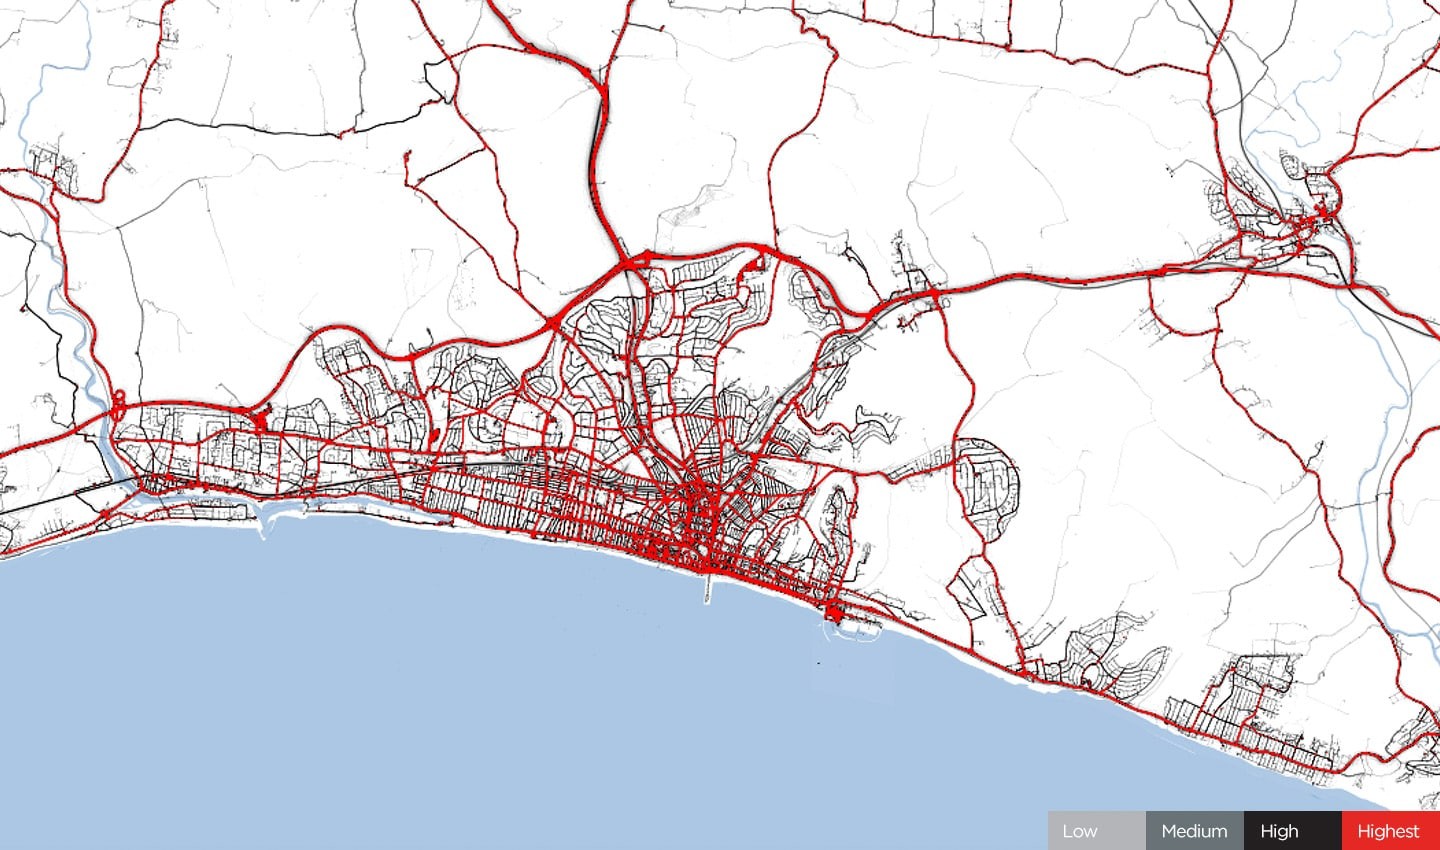 Fig. 13 – Brighton, Easter weekend 2019.
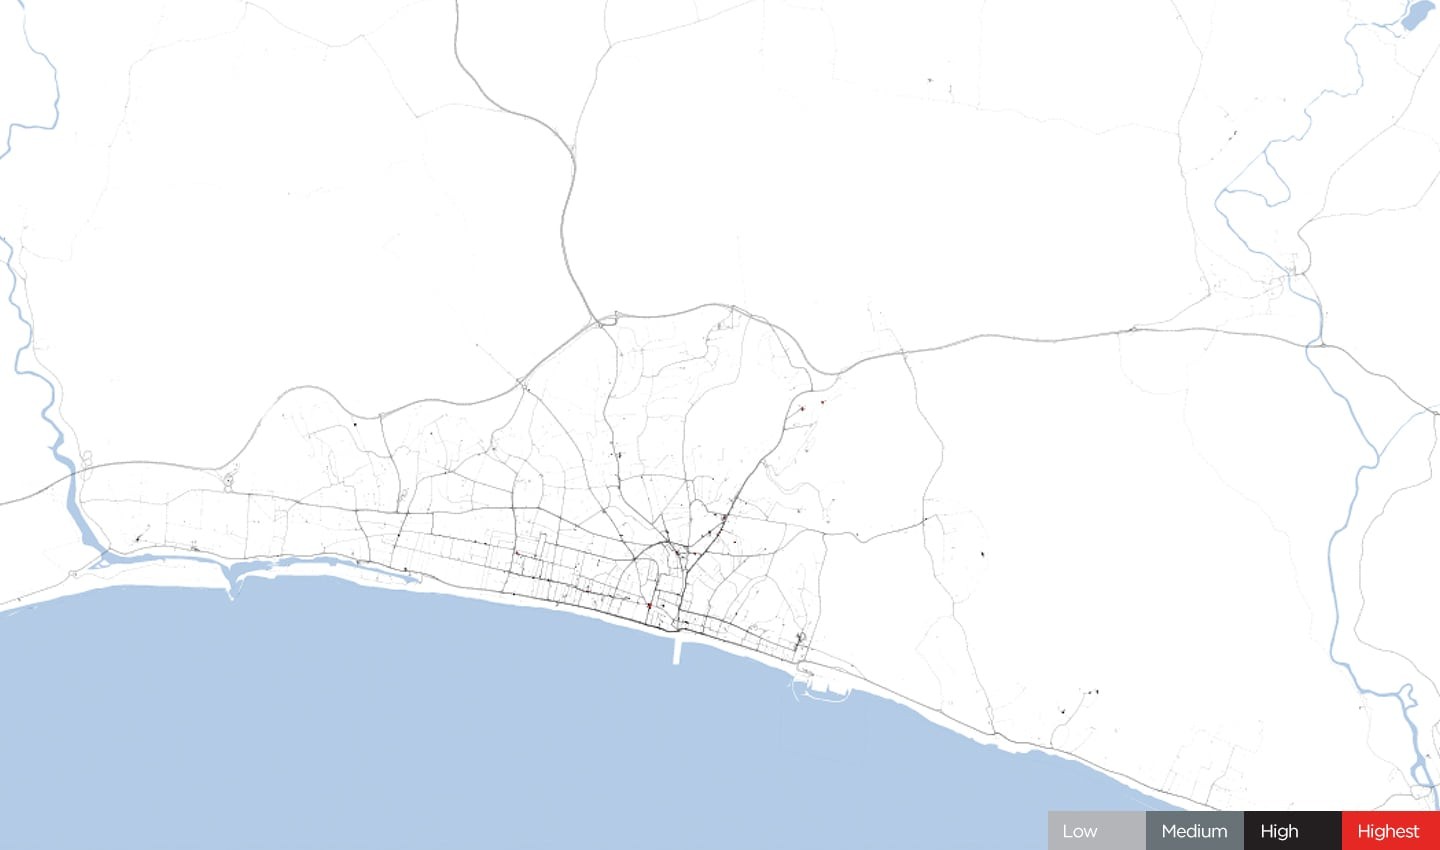 Fig. 14 – Brighton, Easter weekend 2020.
Cities such as London and Birmingham stayed relatively quiet, while popular coastal towns such as Brighton, one hour away from London, showed little to no traffic over the holiday weekend.
The method
The traffic data for this analysis stems from over 600 million connected devices to measure and track traffic across the world every day.
While these results are interesting to study, their interpretation needs to be carefully considered. If a city shows less of a mobility reduction than another city, this does not mean that there is less compliance with movement restrictions. A city could be home to an essential industry or a higher number of key workers and simply cannot reduce mobility further.
To make the most out of this data, it should be correlated and combined with other sources. We are actively working with government agencies and other organizations to support the fight against COVID-19.
Using the power of traffic data
Since the start of the pandemic, TomTom has received hundreds of requests for analysis of how traffic patterns have shifted as travel restrictions have gone into effect around the world. Traffic reflects movement and is a key insight into the spread of the coronavirus. We will continue to help in any way we can.
Track the coronavirus through traffic
In these pressing times, reach out to explore the ways in which we can help.
People also read
)
Maps for providing care: TomTom’s key partnerships save lives in rural areas
)
The TomTom Traffic Index: An objective measure of urban traffic congestion
)
Traffic data: The key to effective road traffic management
* Required field. By submitting your contact details to TomTom, you agree that we can contact you about marketing offers, newsletters, or to invite you to webinars and events. We could further personalize the content that you receive via cookies. You can unsubscribe at any time by the link included in our emails. Review our privacy policy.