)
Almost 60% of the world’s population now lives in urban spaces. That puts pressure on city and state governments to keep these places livable, accessible and equipped to support billions of residents. To help make their task easier, TomTom recently launched Area Analytics — a tool that combines world-leading, on-ground traffic data with big-picture insights.
As urban planning gets more complex, city and state officials work with transportation managers and agencies to tackle challenges beyond congestion — making cities safer, accessible and sustainable on tight budgets. Seeing the big picture helps pinpoint priorities and uncover why problems exist. Are traffic jams due to bad signal timing or poor infrastructure? Can emergency responders make their way around a city easily in case of natural disasters or a big sporting event? Without these layered insights, solutions are just guesses.When it comes to addressing these complex challenges, traditional methods fall short. Static data and surveys can give snapshots but miss the dynamic nature of urban movement, which shifts with seasons, construction and even events. Planners need tools that reveal trends and trouble spots with precision. That’s where Area Analytics comes in.
Area Analytics: The big picture
For three decades, TomTom has been building the world's best traffic database. Historical datasets span years of real-world movement, capturing everything from daily commute patterns to how cities respond to major disruptions. Hundreds of data sources combined with live data have led to a database more powerful than any other in existence. After 15 years of producing the annual Traffic Index, which has become the benchmark for understanding congestion in cities worldwide, TomTom realized cities and urban planners wanted more. They needed to understand what was driving congestion in their own streets, neighborhoods and corridors. They needed insights for areas beyond a few hundred cities, including smaller towns, specific districts or connections between multiple municipalities.Area Analytics emerged from this realization. It provides a comprehensive view of traffic within any defined area, combining the breadth of regional trends with the depth of street-level insights. It transforms raw traffic data into actionable intelligence that answers not just "How congested are we?" but "What's causing it, where exactly is it happening and what patterns should we address?"
“Jarmila Kaiser
Product Manager, Area Analytics
The depth and breadth of the data
What makes Area Analytics truly powerful is its ability to scale across both space and time in ways that previous tools couldn't. It combines the functions of several TomTom Move Portal tools — Historical Volumes, Traffic Stats, Origin/Destination and more — into one. Using hourly historical data from 2018 onwards, the tool offers a yearly overview that reveals longer-term trends. This historical depth is particularly valuable because it includes pre-COVID data. The pandemic years of 2020 and 2021 were exceptional, so being able to look at 2018 and 2019 provides a better baseline for understanding normal traffic patterns. The tool captures how traffic evolves throughout the week with an 'average week' view that shows typical congestion patterns for each day and hour. This makes it easy to spot recurring issues, whether it's Tuesday morning congestion or Friday evening bottlenecks. It even factors in weather impacts. When snowstorms moved across US states or typhoons hit coastal Japan, Area Analytics revealed how traffic changed, showing not just reduced volumes but also altered travel patterns. Area Analytics works at any scale. The smallest area it can analyze is approximately 300 square meters, small enough to examine a specific street intersection. The other extreme, it can provide analysis for entire countries or even continents, including all of Europe and the United States.
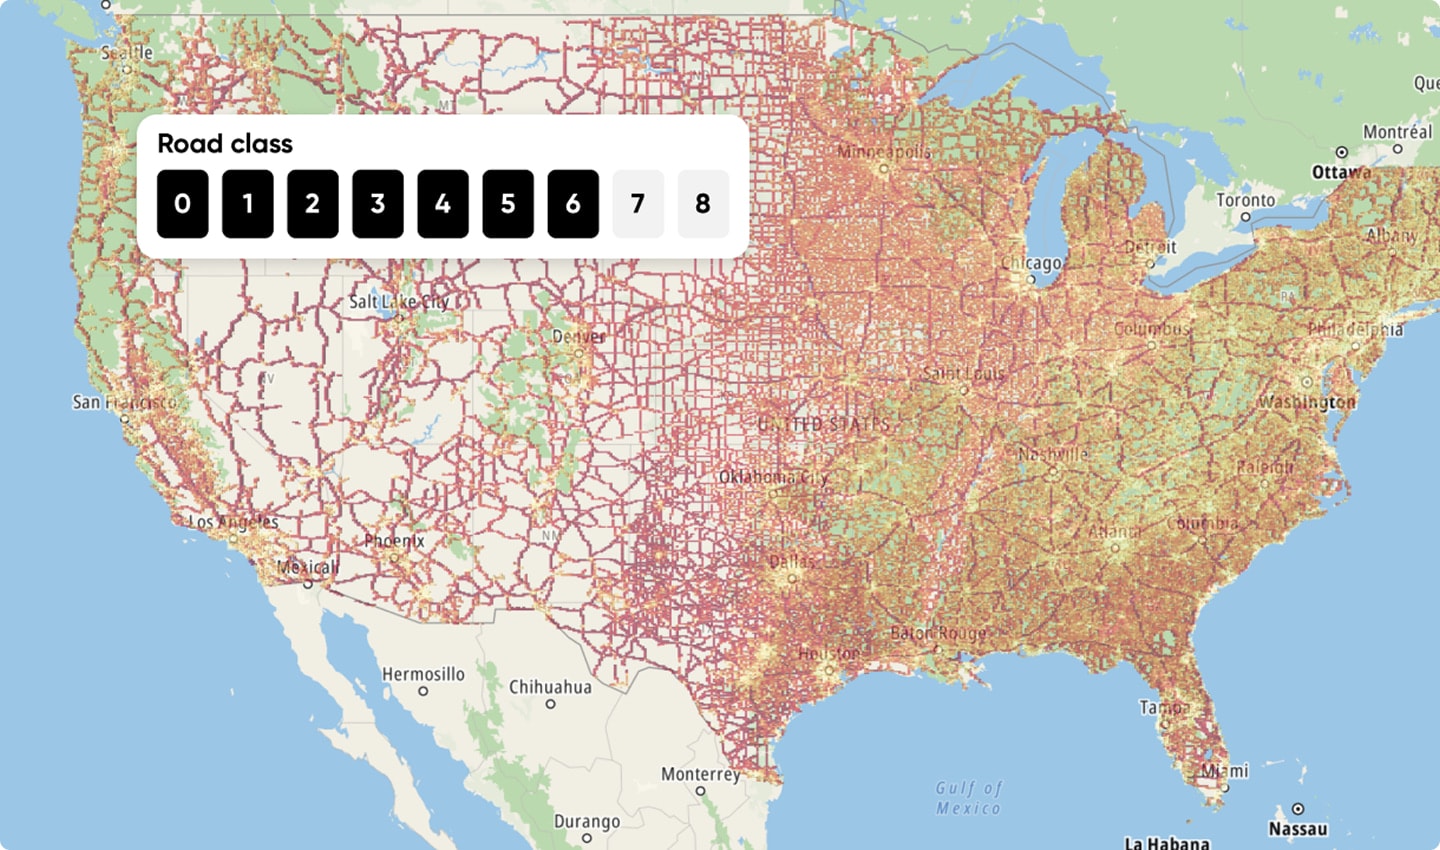
This flexibility means the same platform that helps a mayor understand a problematic junction can also assist regional planners evaluating traffic flows across state lines. A municipality can analyze not just major cities but also smaller surrounding towns, all within a single report, comparing patterns and identifying whether bottlenecks occur on specific days or times.
In the real world
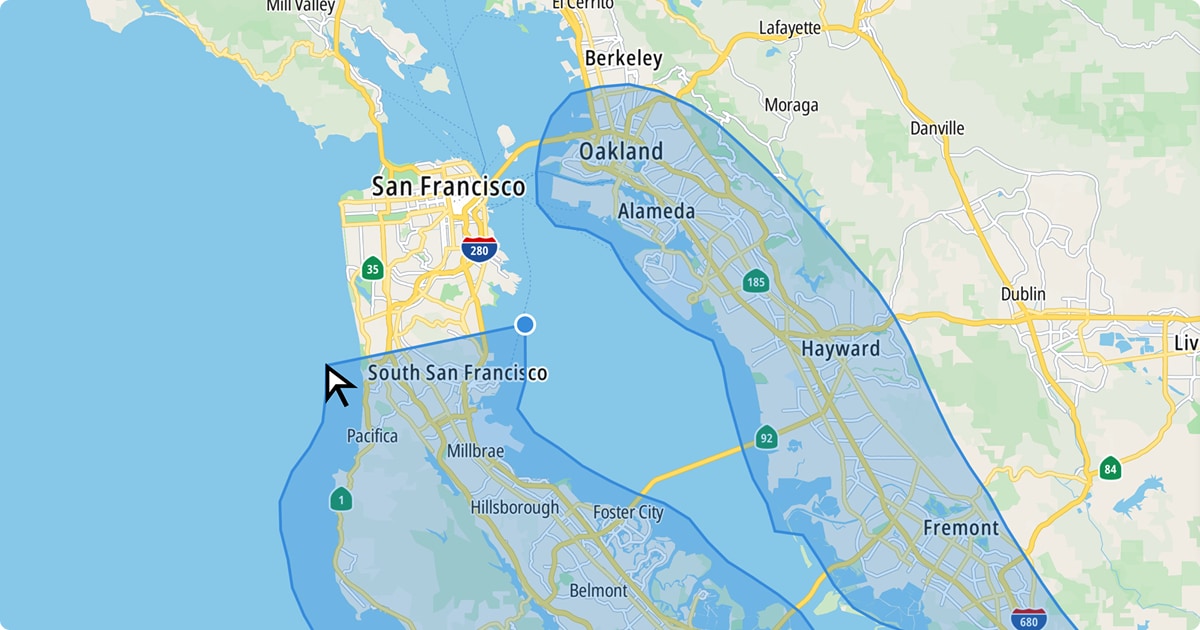
With Area Analytics, urban planners can go from data to decision. Starting with the higher-level picture, planners identify patterns across the city. Which districts show the most problematic traffic? Visual maps with color-coded congestion levels make it immediately clear where issues concentrate.
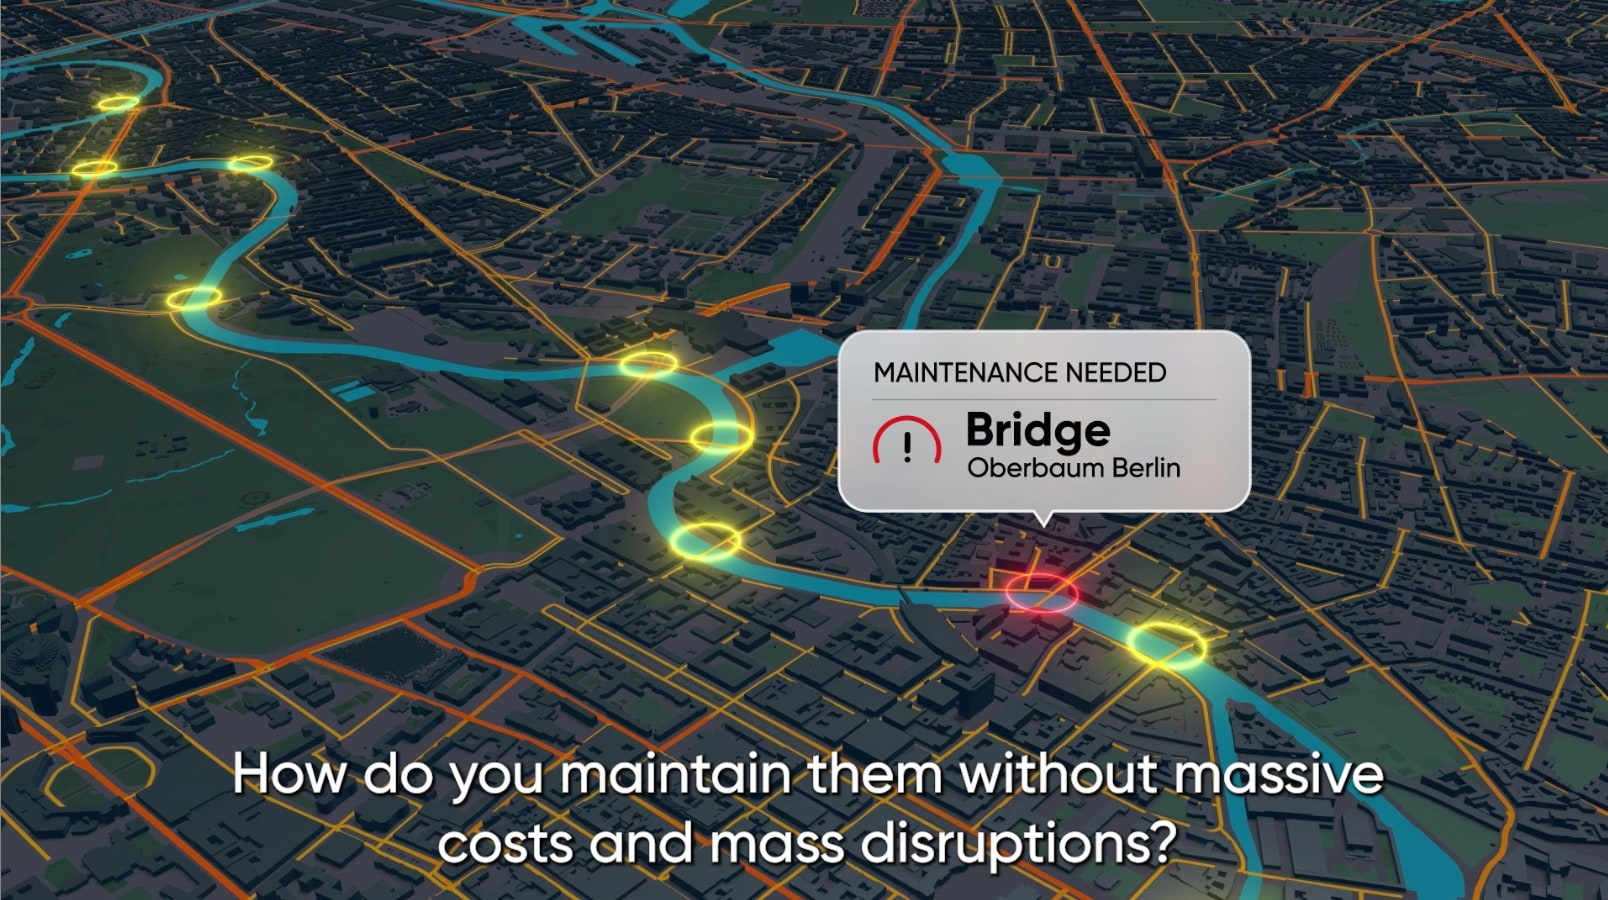
When it comes to managing urban spaces, there are a few key areas where planners need support: improving mobility and safety through traffic optimization and speed monitoring; enhancing emergency response by understanding traffic during major events and optimizing emergency routes; infrastructure planning and maintenance; and shaping policies by validating the effectiveness of changes and measuring impact on safety and sustainability goals. Area Analytics, combined with a suite of TomTom Move Portal solutions, supports all these use cases and more.
Once priority areas are identified, planners can drill deeper. Origin-Destination Analysis reveals where people are traveling to and from, informing decisions about new infrastructure. When analysis reveals a hotspot at a junction, Junction Analytics can show that perhaps 90% of vehicles are turning left at an intersection not designed for that volume. This specific insight might lead to retiming signals, adjusting lane markings or redesigning the junction entirely.
Beyond cities: New applications emerge
While urban planning remains the primary use case, Area Analytics is finding applications in other sectors. The insurance technology space, for example, is exploring how the combination of TomTom's map data, historical traffic patterns and live traffic information can improve risk profiling and claims validation. Analytical insights like these can also prove valuable for the automotive sector. Vehicles that understand which corridors experience the worst congestion on specific days can help drivers plan long journeys more effectively, avoiding predictable traffic jams during holiday periods or major events. Urban planning has always been about making the right decisions for the people who live, work and move through cities. What's changed is the scale of the challenge and the tools available to meet it. As cities become more complex than ever, our ability to understand them must evolve too. Area Analytics represents the next generation of traffic intelligence, combining TomTom's 30 years of mapping and data expertise with analytical capabilities designed for simplicity and clarity. The interface presents complex traffic data through intuitive visualizations, color-coded maps and heat maps that make patterns immediately visible. The tool is available now through Move Portal, TomTom's platform for accessing traffic services and analytical solutions. Whether you're managing transportation for a metropolis, planning infrastructure for a mid-sized city or analyzing patterns across a region, Area Analytics provides the insights needed to make confident, data-driven decisions.
People also read
)
New York: The slowest moving city in the U.S.
)
[Long read] TomTom’s City of the Future: A vision for smarter, more livable urban spaces
)
Slowing down to move forward: Effects of lower speed limits across cities
)
Mapping road risks: How AI and data are revolutionizing traffic safety
* Required field. By submitting your contact details to TomTom, you agree that we can contact you about marketing offers, newsletters, or to invite you to webinars and events. We could further personalize the content that you receive via cookies. You can unsubscribe at any time by the link included in our emails. Review our privacy policy. You can also browse our newsletter archive here.