


)
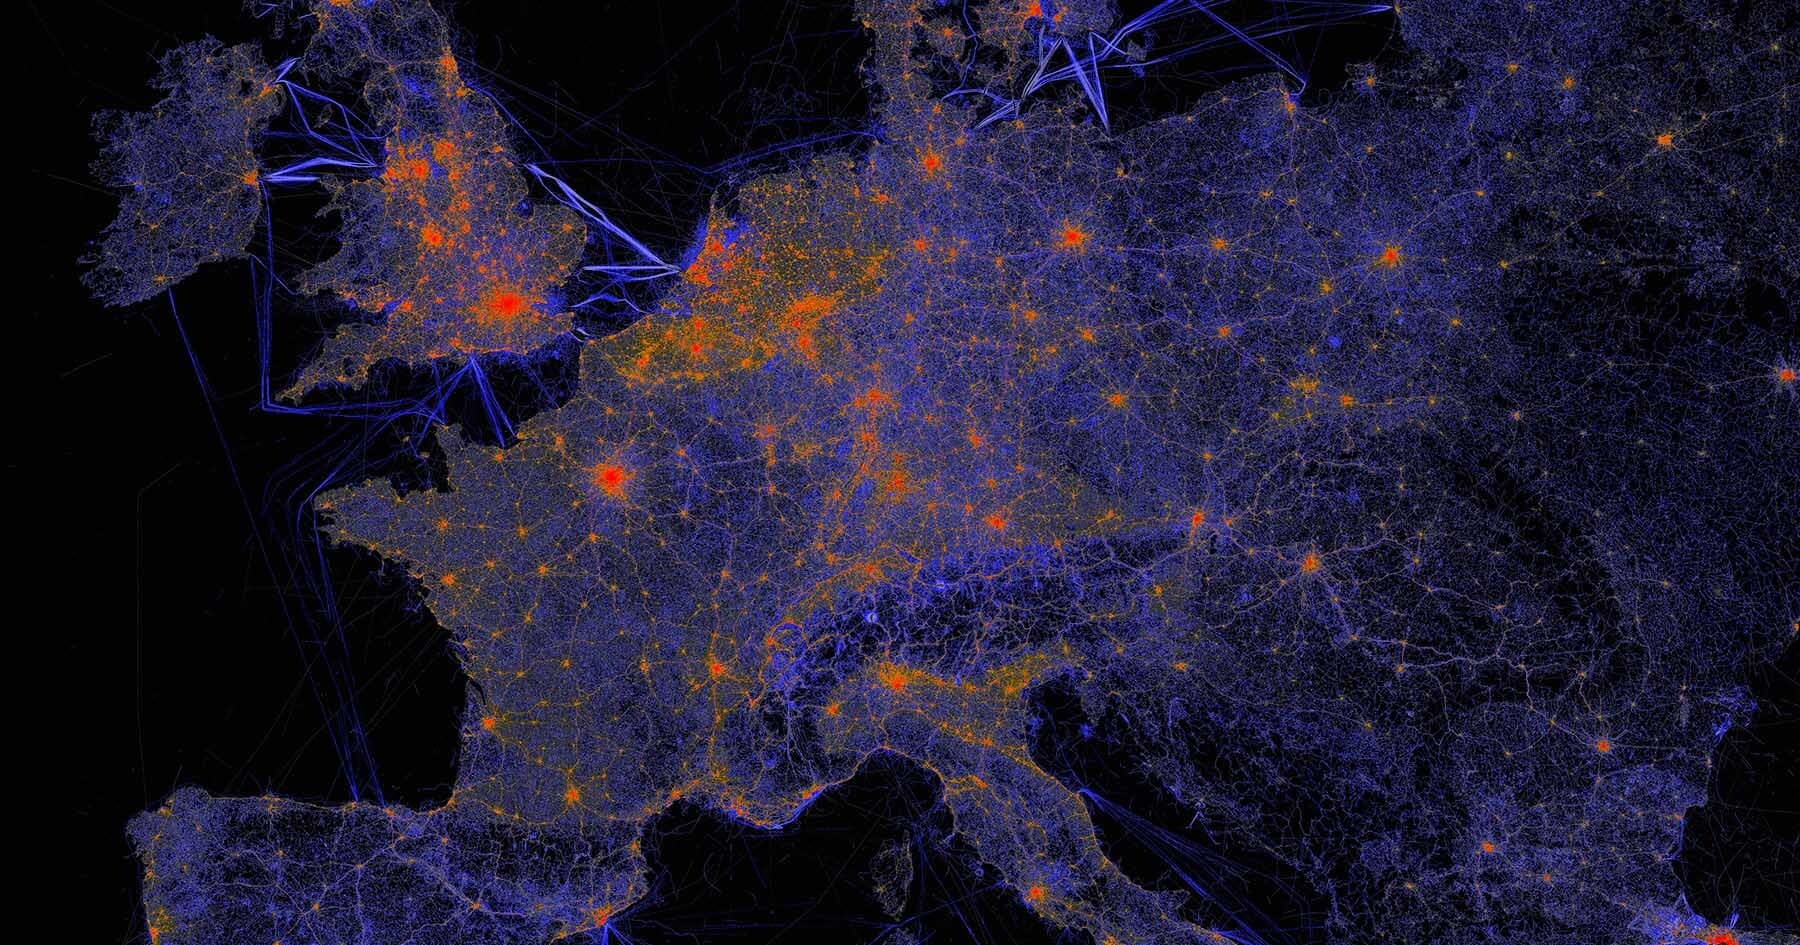
When public agencies or insurance businesses choose traffic data on price alone, the real cost isn’t just what shows up in the procurement line, it’s what shows up in the decisions that follow.
Procurement pains
There’s a familiar pattern in public sector procurement. A tender goes out. Suppliers respond. Requirements are met. Boxes are ticked. And more often than not, price becomes a key deciding factor.
Given the nature of public sector business and who they serve, it’s not surprising that costs feature highly in decision making. Budgets are tight. Spending is scrutinized. And traffic data, now provided by many providers and sources, can look like an undifferentiated commodity.
For agencies and their partners, evaluating traffic data quality upfront is notoriously difficult. Penetration, accuracy and validation don’t show up clearly in tenders, which means price often becomes the most visible and decisive point of comparison.
Saurav Miglani, Public Sector Segment Lead at TomTom, explains, “Data availability is one thing. But penetration, accuracy and latency are what defines the true quality.”
It’s a distinction that doesn’t always appear in the procurement process but will show up everywhere after.
 From counting cars to observing entire networks
To understand the disparity in quality across traffic data, it helps to understand where modern traffic data, from TomTom, comes from.
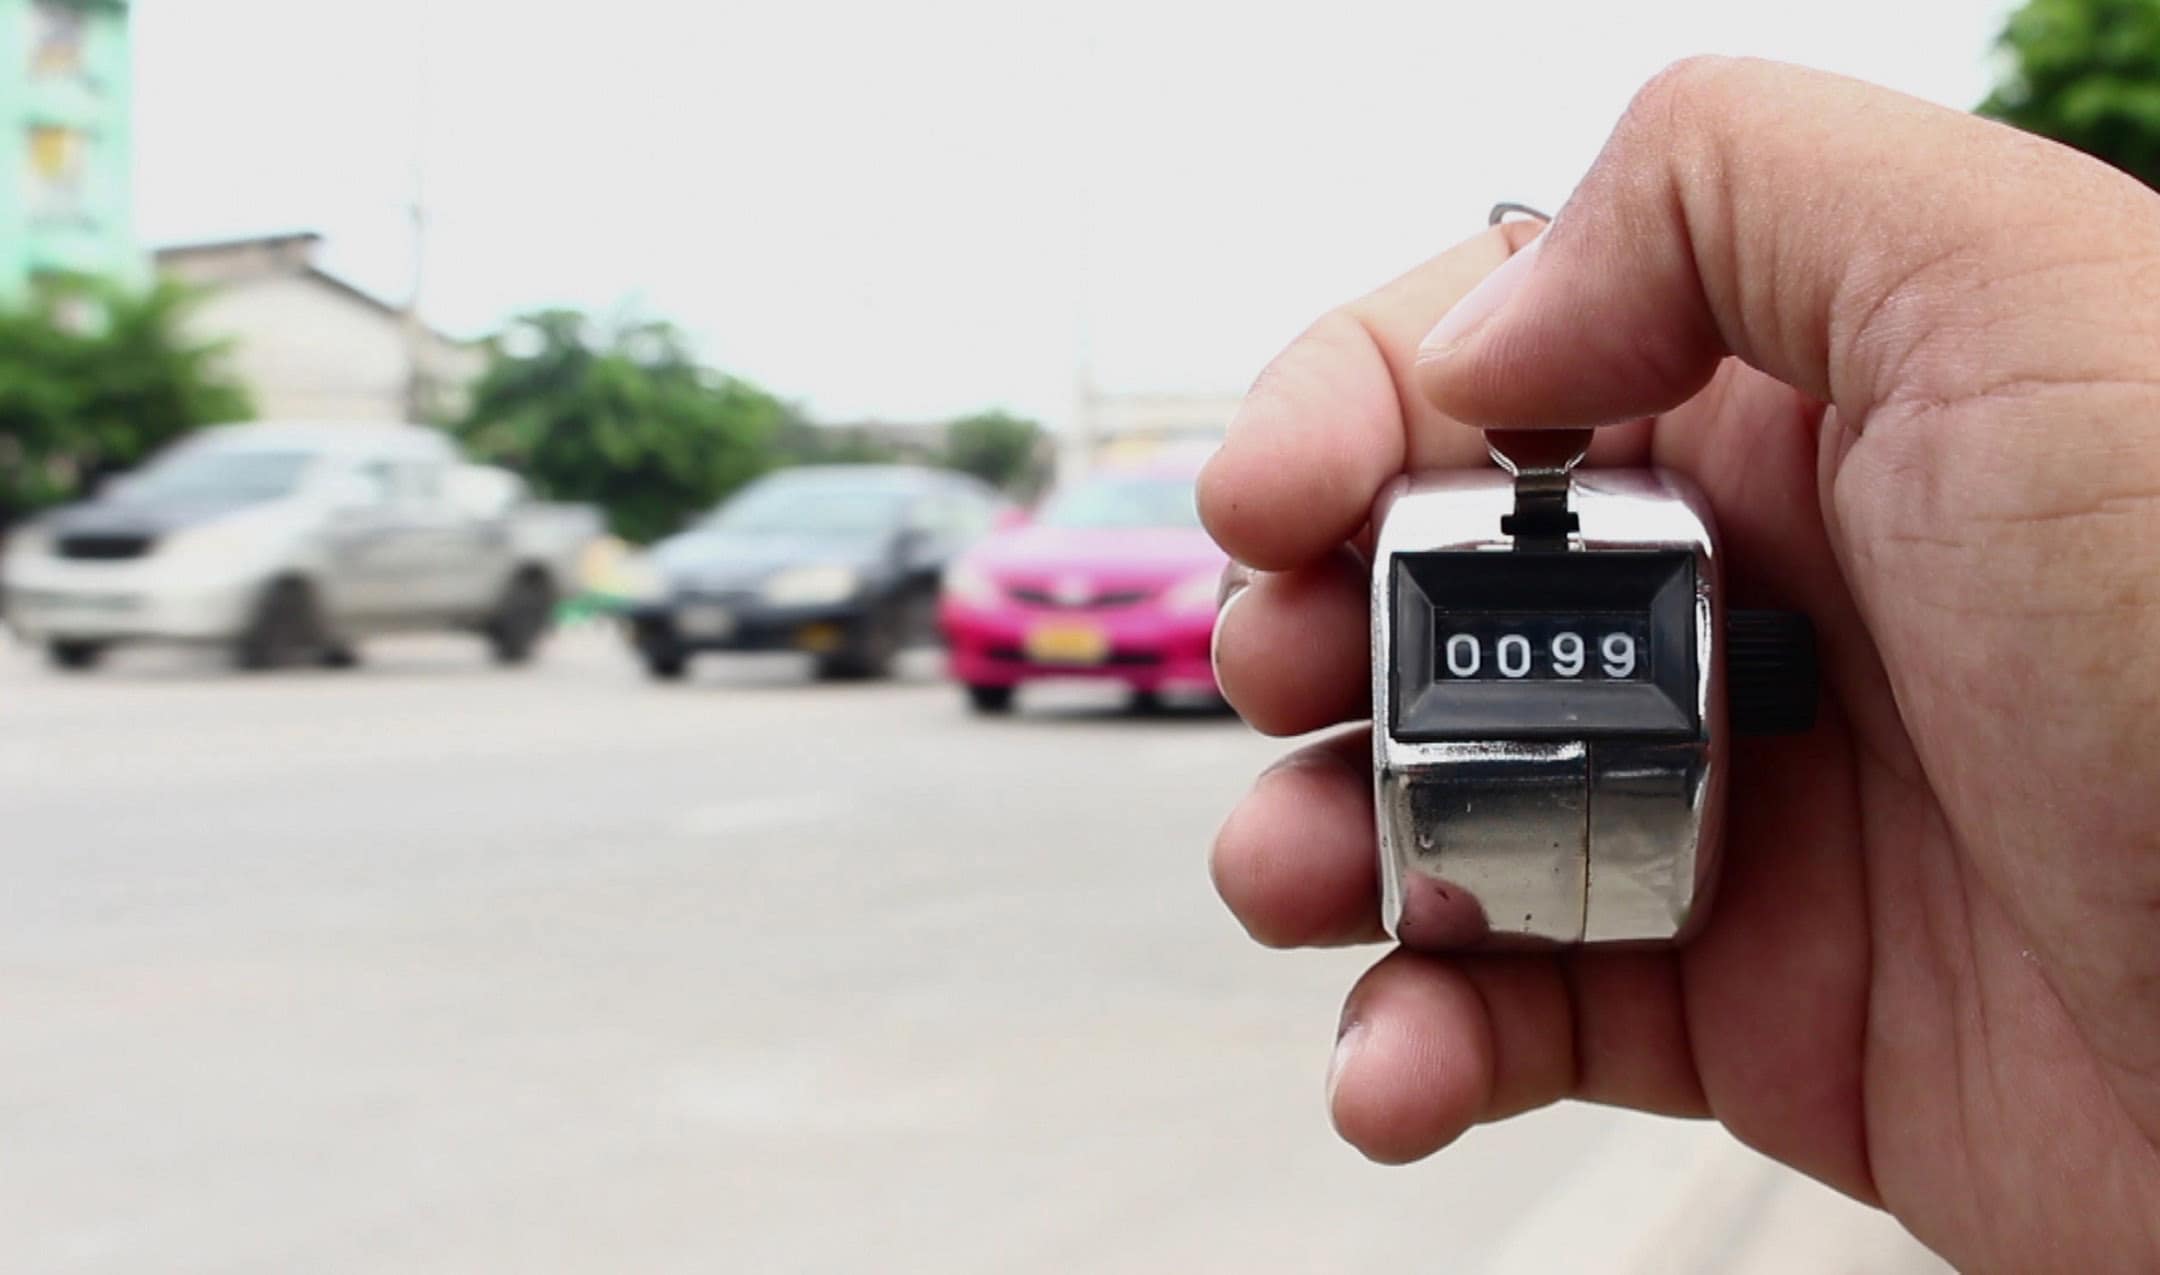
For decades, traffic data was something built locally and slowly. People would stand at junctions, manually counting vehicles by hand. Later came induction loops, pneumatic tubes and roadside sensors. These technologies were improvements but came with drawbacks — they were tied to very specific locations, required continual maintenance and were costly to scale.
You could estimate and interpret what was happening on a given road, at a specific location, at a specific time. But you couldn’t do much beyond this. Understanding how traffic moves across routes, corridors or entire networks, remains slow, fragmented and expensive.
“Historically, traffic data was collected through very manual methods,” Saurav explains. “You were restricted to specific locations. And most importantly, you didn’t have visibility across the road network, just a few locations.”
That limitation shaped how cities operated. Decisions were made with limited overviews. Models were built more on assumption than insight. Planning relied on extrapolating data that was statistically weaker than modern traffic data.
Now, we have vehicle probe data — and with it, a step change in traffic data quality.
Instead of observing traffic at fixed points, data started to come from the vehicles themselves by way of Floating Car Data. Movement, speed, motion, delays — captured across entire road networks, in real time and over years.
“That [FCD] changed everything,” Saurav says. “We moved from a partial understanding of our road networks to evidence-led decision-making, grounded in statistically significant penetration across the network.”
The traffic data equivalency illusion
Today, traffic data is abundant.
There are multiple providers offering coverage across cities, regions and even entire countries. Dashboards look familiar. Outputs look comparable. And crucially, most providers can meet the minimum requirements set out in a tender.
Which creates a problem, because not all traffic data is equal — even if it looks that way.
“You might have data with lower penetration rates,” Saurav explains. “You can still generate the same analysis. The same charts. The same dashboards. And attempt the same analysis, but you will not reach the same conclusions with the same confidence.”
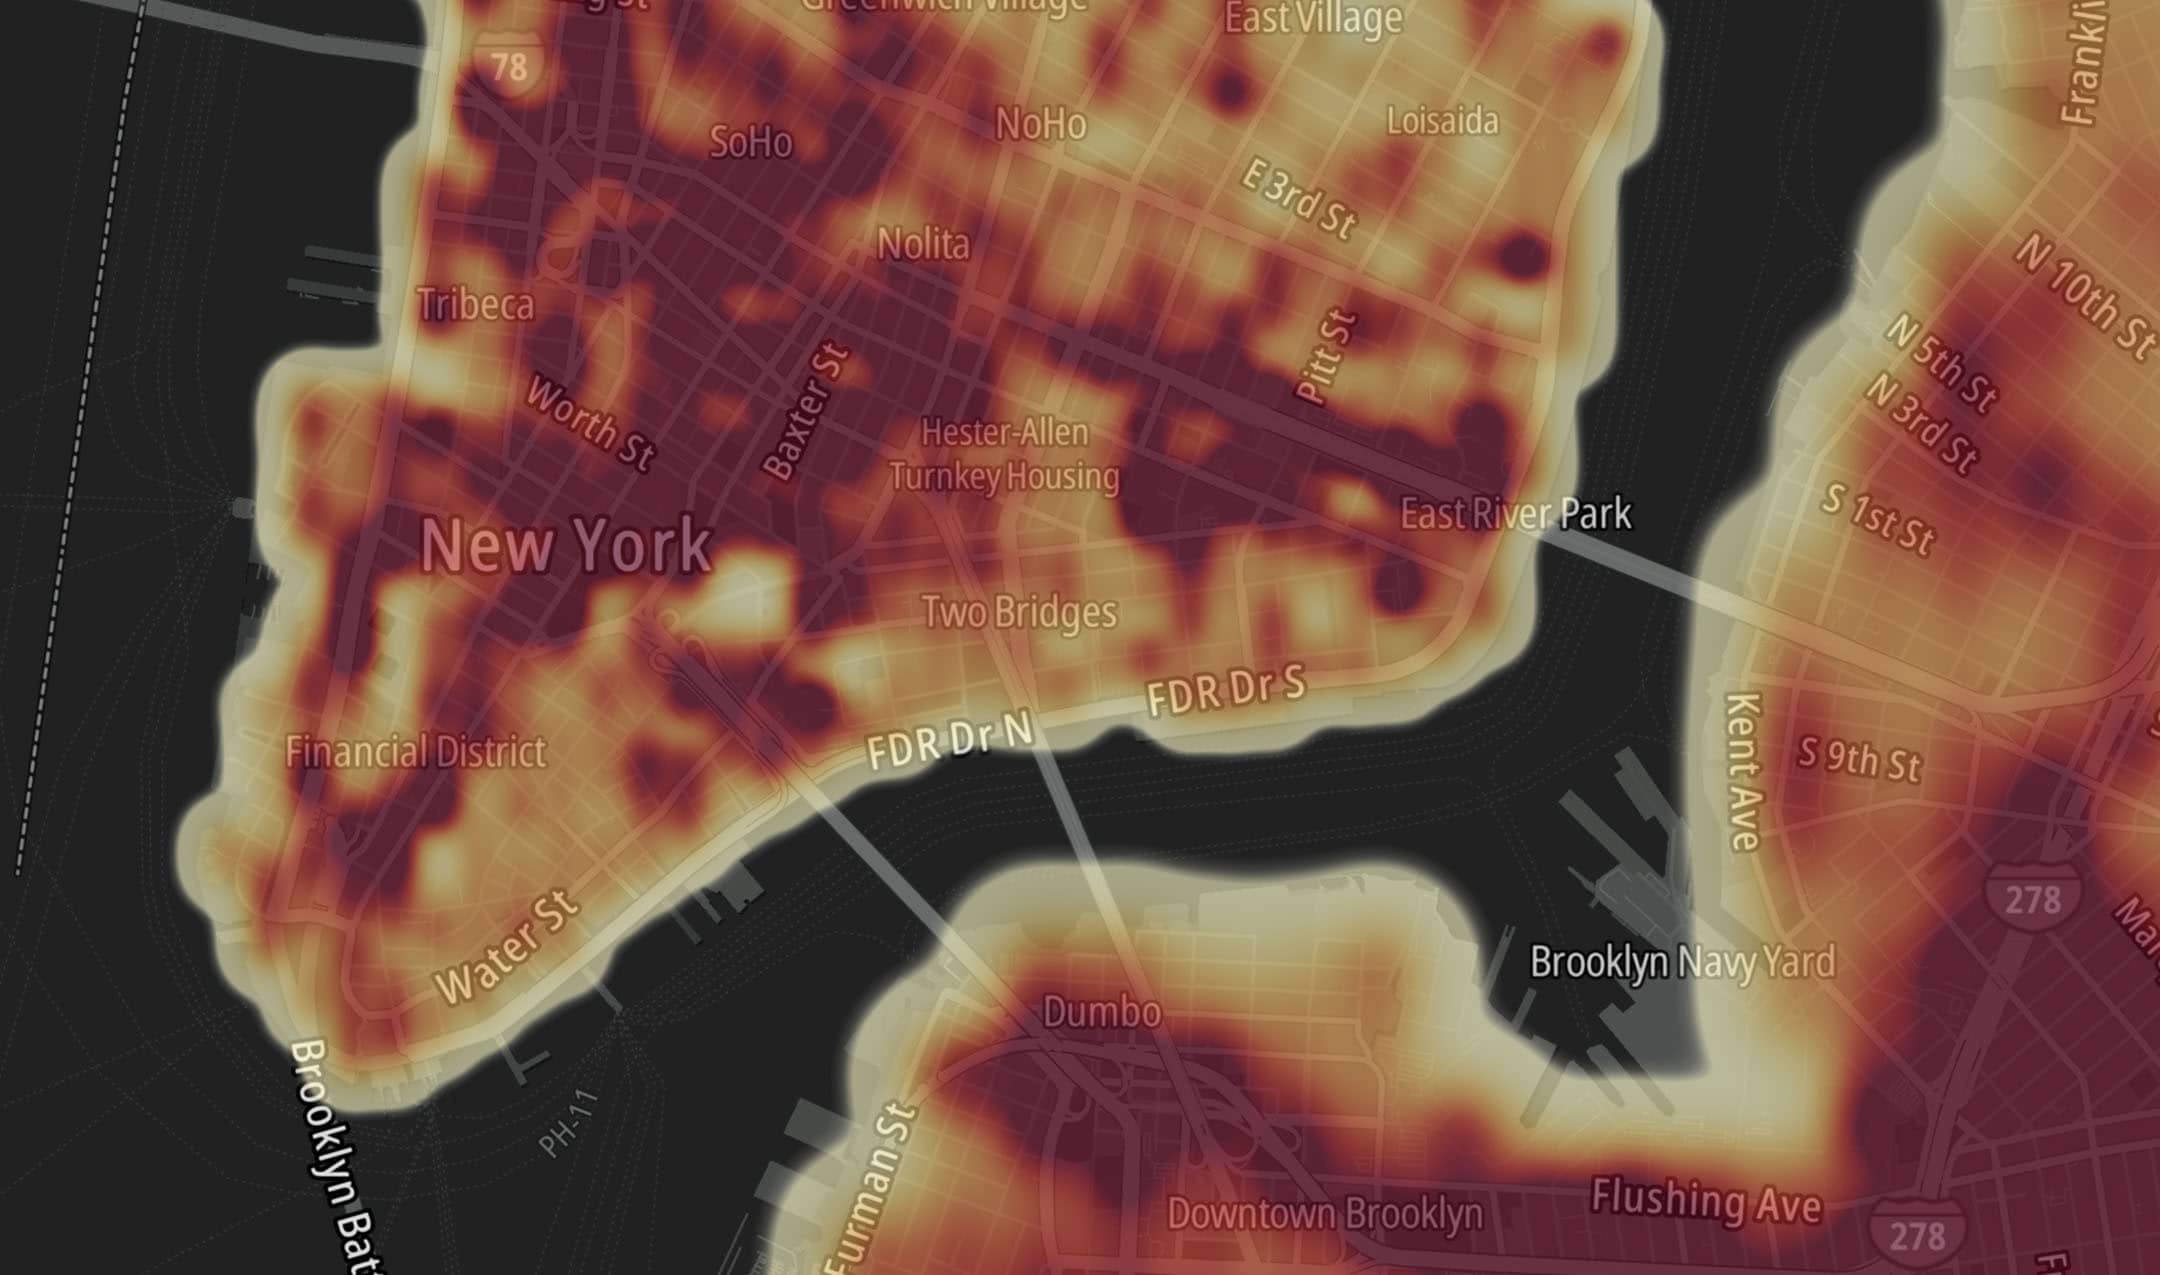
Two datasets can produce similar-looking outputs, and their user interfaces can look identical and offer the same analytical tools — but underneath they are built on very different realities. One shows what’s really happening, everywhere. The other shows something close enough to pass, in limited survey locations.
The difference becomes visible when that data is used to make important decisions or conduct deep, years-long analytical studies where confidence, consistency and statistical strength matter and multiply over study’s duration.
“When you actually implement that data in policy or planning process,” Saurav continues, “that’s when you realize the cost of using data that isn’t representative of reality and decisions are built on assumptions not data-driven insight.”
Where quality shows itself
For public agencies, that gap between representation and reality shows up quickly, but quietly.
In real-time road management operations, it can mean responding too slowly to incidents. High-quality, high-penetration data can detect disruptions in minutes — identifying abnormal congestion patterns as they emerge. Lower-penetration data might only pick up those signals once they become obvious at survey locations.
In infrastructure planning processes, the impact compounds. Transport models rely on historical data to simulate future scenarios. If the baseline data is incomplete or only available for a handful of sample durations, the model becomes skewed — and the investment decisions that follow inherit that uncertainty.
When it comes to road safety, the cost of incomplete data becomes harder to ignore.
Vision Zero strategies depend on being able to identify risk, not just where accidents have happened, or at survey locations, but where they’re likely to happen. That requires consistent visibility across the network. Without it, risk remains unevenly understood and something that can only be studied in hindsight. As a result, safety programs become more about reacting to known incidents, rather than using data to uncover hidden risk and prevent them altogether.
“For all applications, agencies need data that reflects how traffic actually moves across entire networks,” Saurav says. “It needs to be representative of reality — especially when decisions are about safety and policy. In the end, the impact should outweigh the cost.”
When the difference becomes obvious in practice
Luigi Sanfilippo, Sales Director at citiEU, a transport modelling firm, describes how dramatically things have changed.
“There was a time when we needed travel times, and we would literally drive the road we needed to survey with a chronometer,” he says. “Now we analyze it from the office. That’s a massive value.”
What’s more, people like Luigi can analyze traffic, on all roads, not just sample locations, from the office, on a whim.
But the real value emerges in edge cases, in the situations where cities are under stress.
During severe flooding in Palermo, citiEU used TomTom data to understand which parts of the network were still operational. Not by identifying congestion or by looking for traffic — but by identifying its absence.
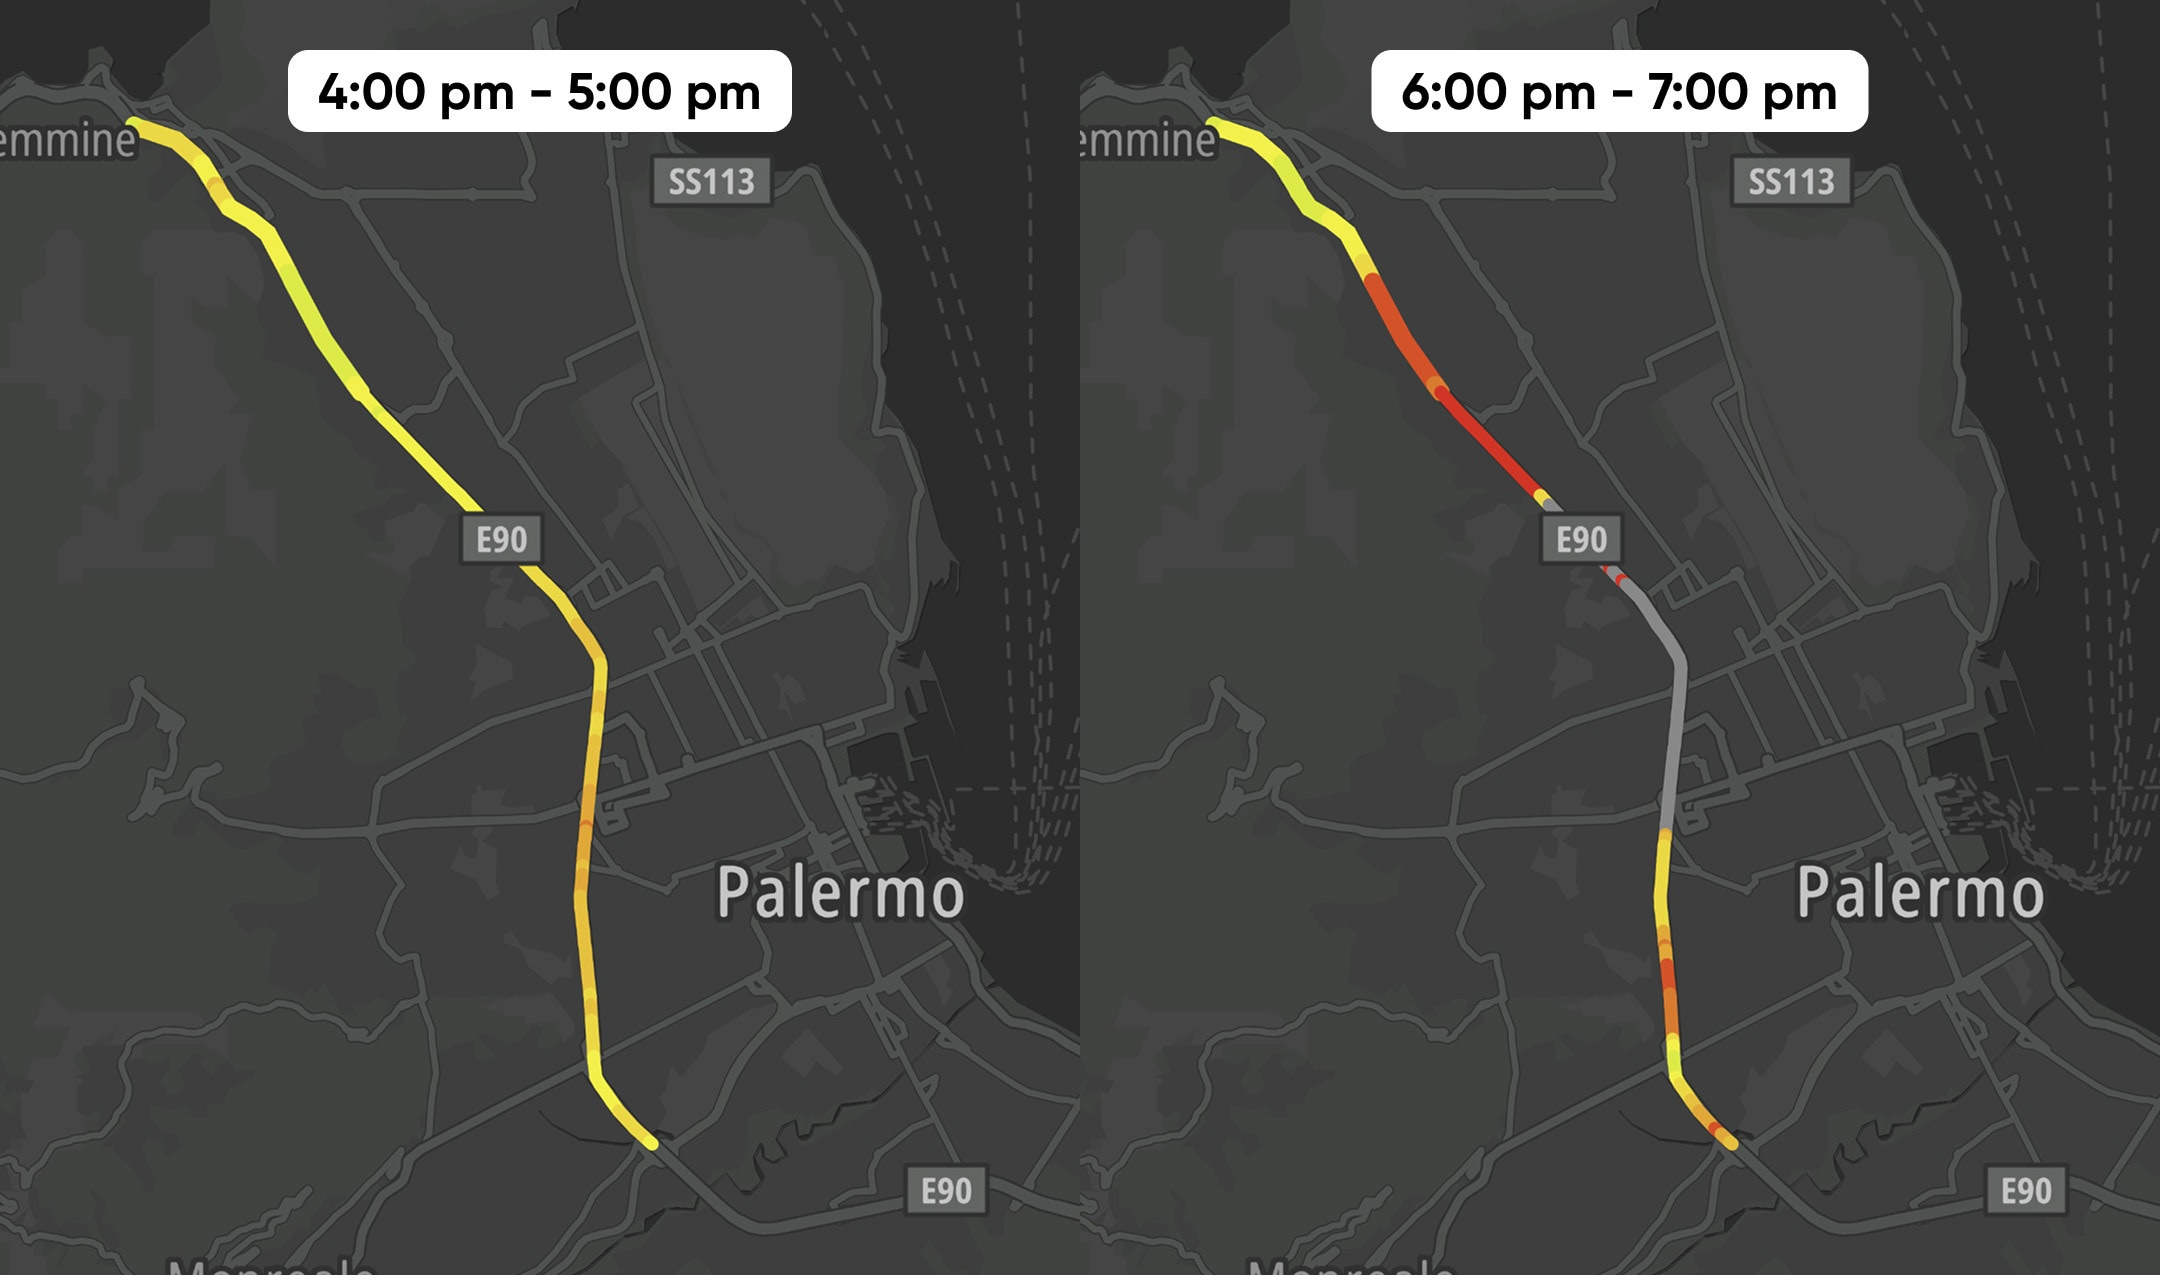
“Where the infrastructure was unusable, we had zero sample size,” Luigi explains. “Nobody was moving, and that showed us which roads were impassable.”
That absence of data — something you can only trust if your coverage is strong and penetration is high — became a clear signal. A way to identify flooded and obstructed roads and support emergency response and planning.
Luigi describes it simply and clearly, as if it’s a small moment, but it captures something important: you can only rely on what you don’t see if you trust what you do.
That same dynamic plays out in more everyday situations.
At Ramboll, a global consultancy working with cities across Europe, TomTom data has become a reference point, a benchmark — not just for analysis, but for validation of other data sources.
“We used to rely on best guesses,” says Eric Edman. “Now we have proven data that we can trust.”
In one case, Ramboll discovered that a traffic count supplier had incorrectly labelled northbound and southbound flows — effectively reversing reality for a key commuter corridor. It only became visible when compared against high-quality probe data over time that showed directional flow.
The point isn’t that errors always happen. It’s that without reliable data, you don’t always know when they do. And over time, the cost of that uncertainty adds up.
“It changes the relationship you have with your clients,” Eric says. “Because you’re not just delivering analysis — you’re delivering confidence.”
Beyond the public sector
The characteristics — accuracy, coverage, historical depth — that make TomTom Traffic Data so valuable in the public sector for infrastructure planning, decision making and emergency response, underpin other industries too.
In insurance, for example, traffic data is used to model risk, validate claims and assess behaviour. High-quality traffic and location intelligence is now being used to power automated AI-backed claims processes, so that customers can be serviced quicker and with greater accuracy. Insurance businesses are using this data to great effect, reducing premiums for customers whilst reducing fraud and keeping margins strong.
The applications are different, but the dependency and need for confidence, is the same. If the data doesn’t reflect reality, neither do the outcomes and that becomes a hidden cost.
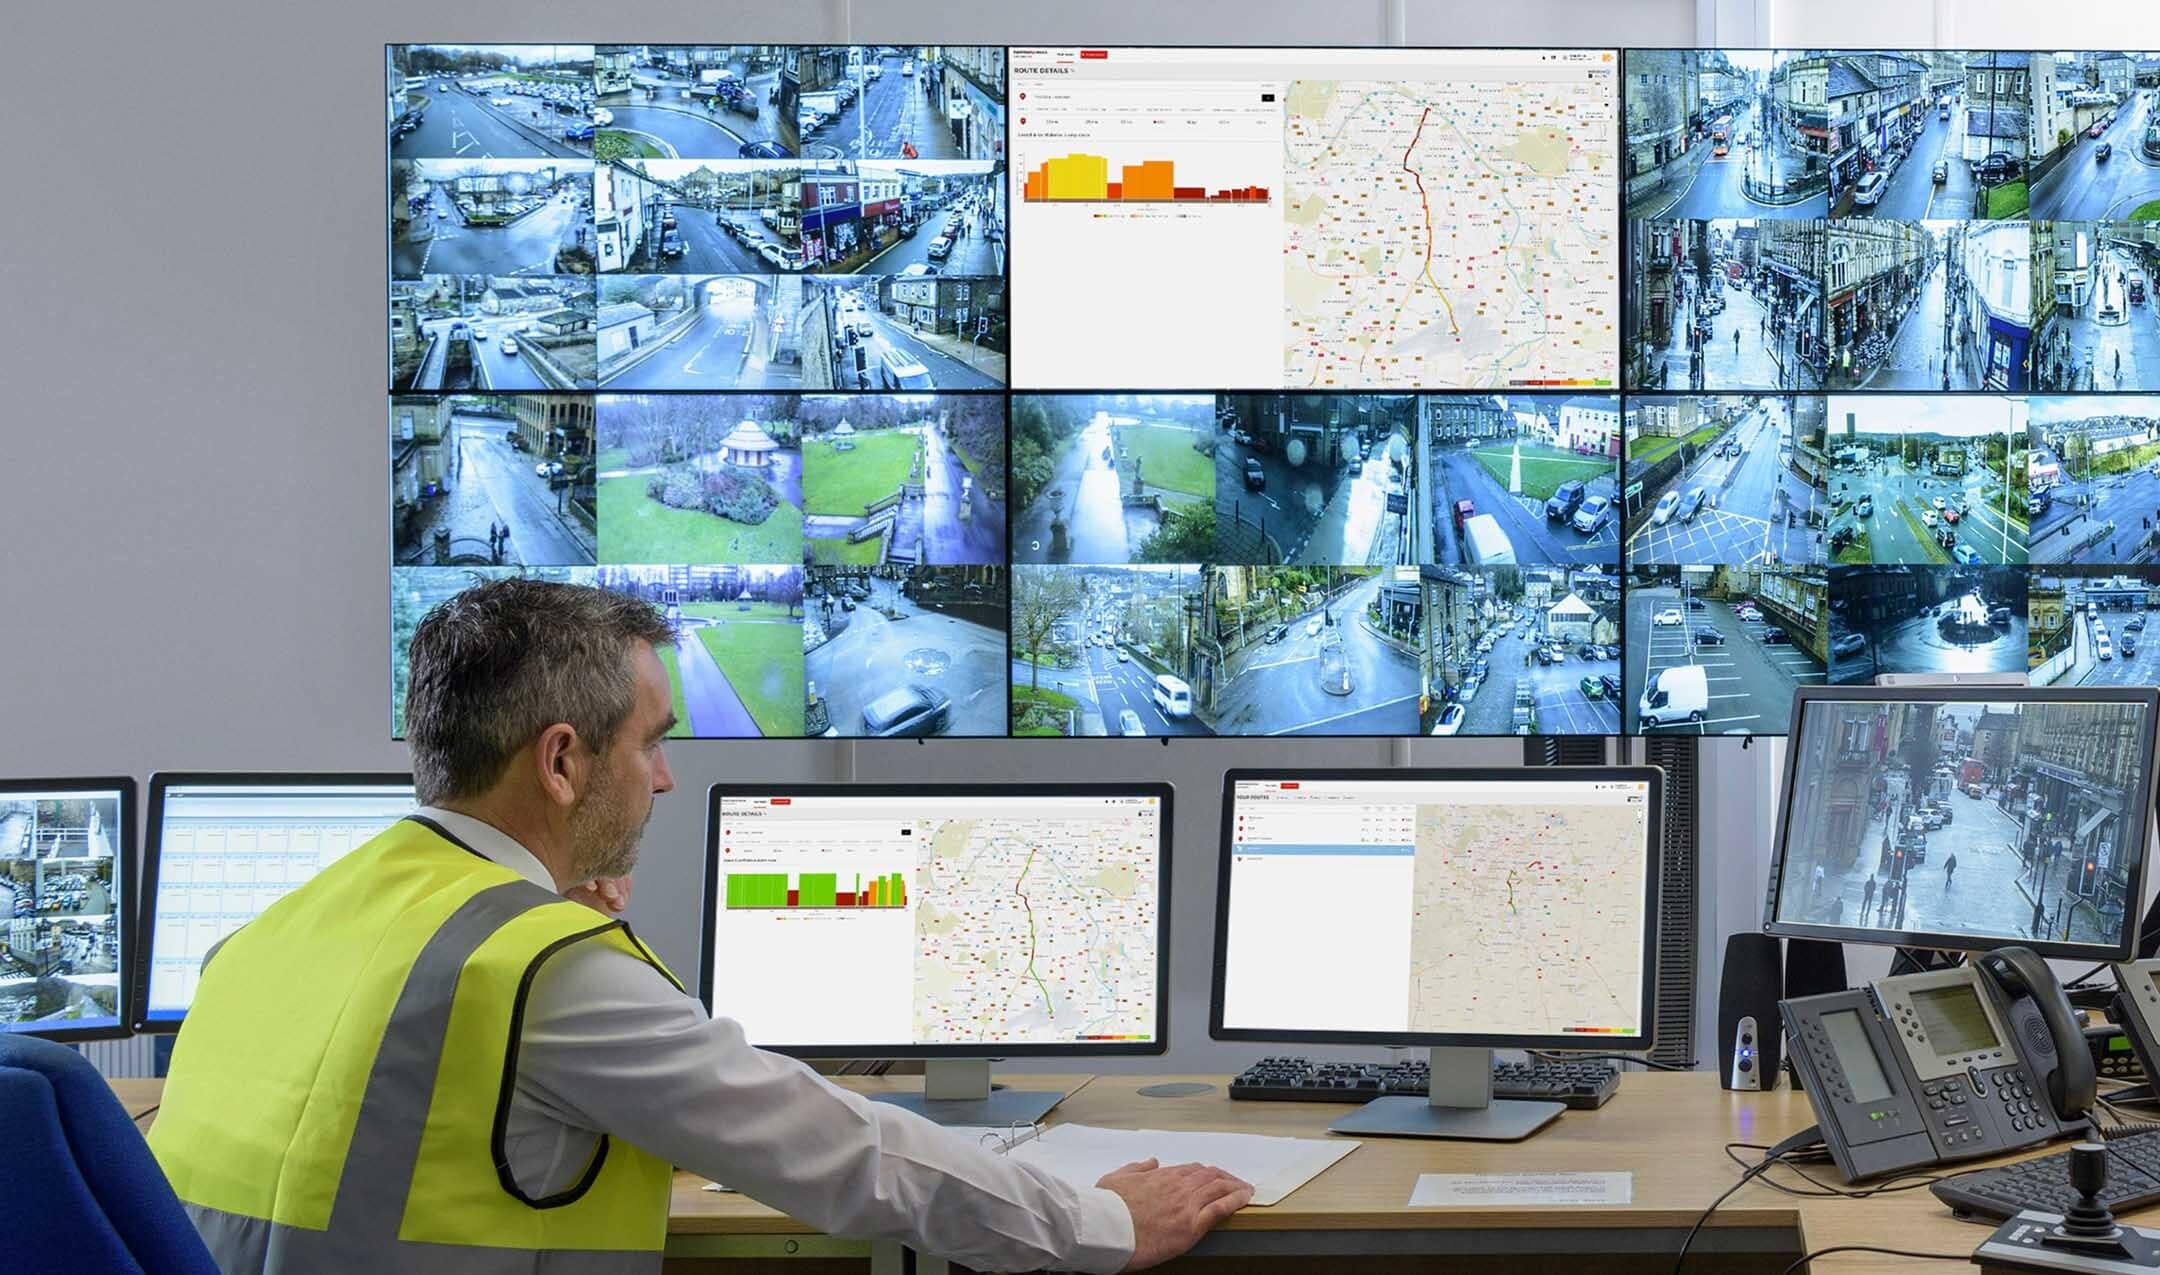
Understanding all the costs
At the procurement stage, when buying traffic data, it’s understandably hard to quantify true quality. Understanding the impact of penetration rate, historical depth and validation processes is significantly more challenging than comparing two providers on costs. Price becomes a clean, simple metric to evaluate options, and consciously or not, may end up carrying more weight than it should when decisions are made.
But the real cost of traffic data isn’t paid when the contract is signed, it’s paid later.
It’s paid when investments in new infrastructure don’t deliver expected improvements in congestion. It’s paid when policy changes don’t make a difference. It’s paid in safety when risk isn’t interpreted correctly. It’s paid in the erosion of trust when results can’t be explained.
“Traffic data supports decisions that affect real-world outcomes,” Saurav says. “And those decisions need to be backed by data you can trust. It’s more effective to invest in high-quality data upfront than to absorb the downstream cost of decisions built on incorrect or incomplete insights.”
Traffic data is no longer just a survey-based reporting tool. It’s become part of the infrastructure that cities depend on — quietly shaping how roads are managed, how investments are prioritized and how safety is improved.
In all of these cases, and as with any infrastructure, its quality determines what’s possible.
“It’s not about whether you have data, just having data is not enough” Saurav says. “It’s about whether you have the right data to make the right decisions to make the right impact.”
People also read
)
)
)
)
* Required field. By submitting your contact details to TomTom, you agree that we can contact you about marketing offers, newsletters, or to invite you to webinars and events. We could further personalize the content that you receive via cookies. You can unsubscribe at any time by the link included in our emails. Review our privacy policy. You can also browse our newsletter archive here.