


)
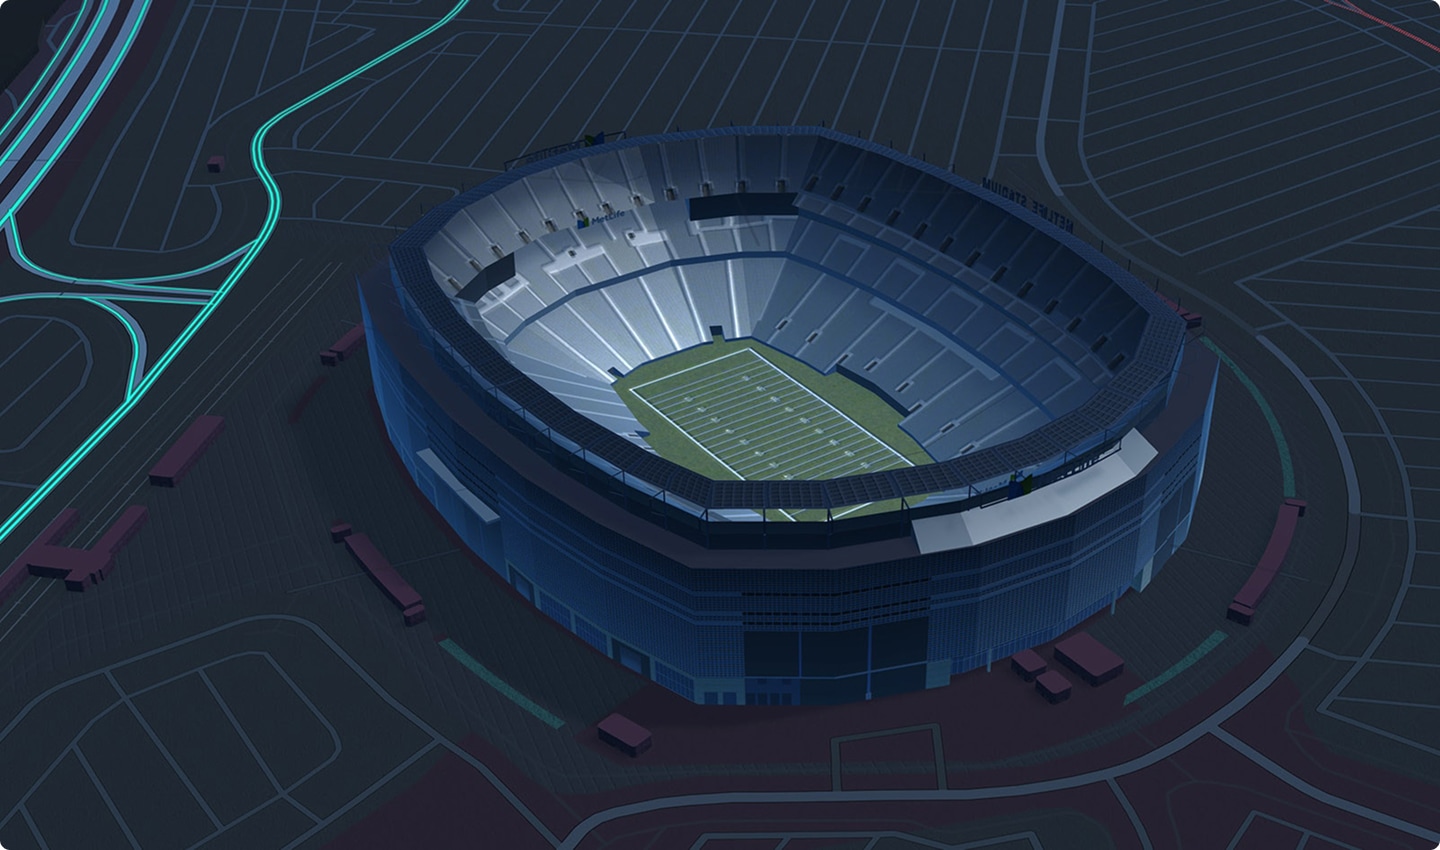
It's hard to predict what will happen inside MetLife Stadium on July 19. But with the right data, predicting what happens on the roads outside is a different story. By analyzing traffic conditions during the seven Football World Cup matches played at MetLife Stadium so far, TomTom has identified three patterns likely to shape the day of the Final.
Before getting into the analysis, it’s worth explaining the main metric we’re looking at: congestion level. This refers to the additional travel time created by increased vehicle movement compared to optimal, free-flow conditions.
This metric is shown as a percentage, indicating the relative increase in travel time due to extra traffic. For example, a congestion level of 100% means a journey takes twice as long as it does under free-flow conditions. It’s the same way TomTom measures congestion in its annual Traffic Index report.
For an easy-to-digest breakdown of the findings that inform the stats referenced in this article, check out this dashboard. You can use it to compare congestion levels across MetLife Stadium matches and explore other factors like travel times, average speeds and more.
With that said, here are three findings likely to impact the Final — and how traffic management authorities, public transport operators and emergency response teams can use live data, route monitoring, historical traffic patterns and mobility intelligence to prepare for them.
Prediction 1: Traffic will spike two to three hours before kick-off
The highest congestion level recorded across all seven matches was 198.4%, which occurred before Brazil and Morocco kicked off. In this moment, it took spectators triple the time to travel compared to free-flow conditions.
What’s more, congestion typically spiked two to three hours before kick-off. This suggests that the most intense pressure on the network will come well before the Final begins.
Now, congestion ahead of an event that captures worldwide attention is hardly revelatory. But for traffic management teams, the real value lies in recognizing when and where that congestion will occur. Knowing that traffic will likely peak at least two hours before the match begins, operators can plan for distinct phases of demand throughout the day — adjusting signal timings, implementing variable speed limits and activating diversion routes to proactively alleviate pressure at chokepoints while circulating accurate estimated travel times to prepare drivers for challenging conditions.
And while getting everyone to the stadium on time is the first hurdle, according to the data, it’s not likely to be the most formidable one.
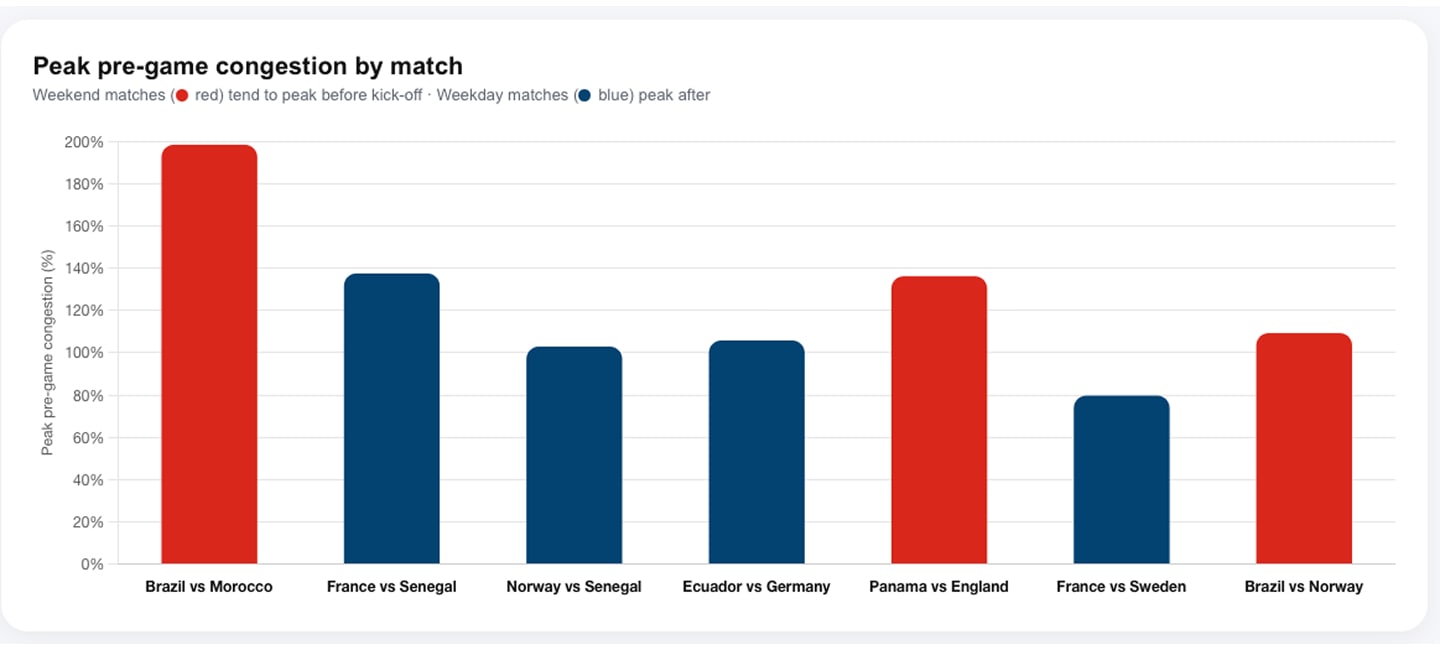 Brazil vs Morocco recorded the highest congestion spike out of all seven matches analyzed. Explore the data.
Prediction 2: The longest disruption will begin after the final whistle
The biggest congestion spike and the most disruptive period of congestion are not necessarily the same thing.
While the single sharpest spike occurred before kick-off, congestion after matches tended to be both higher on average and slower to dissipate. Across all seven games analyzed, post-match congestion averaged 108.1%, compared with 87% before matches.
Five of the seven matches analyzed recorded higher post-match congestion levels than pre-match congestion, with the highest post-match reading reaching 153.2% after France vs Senegal — the only match in the dataset that shares the Final's 15:00 kick-off time.
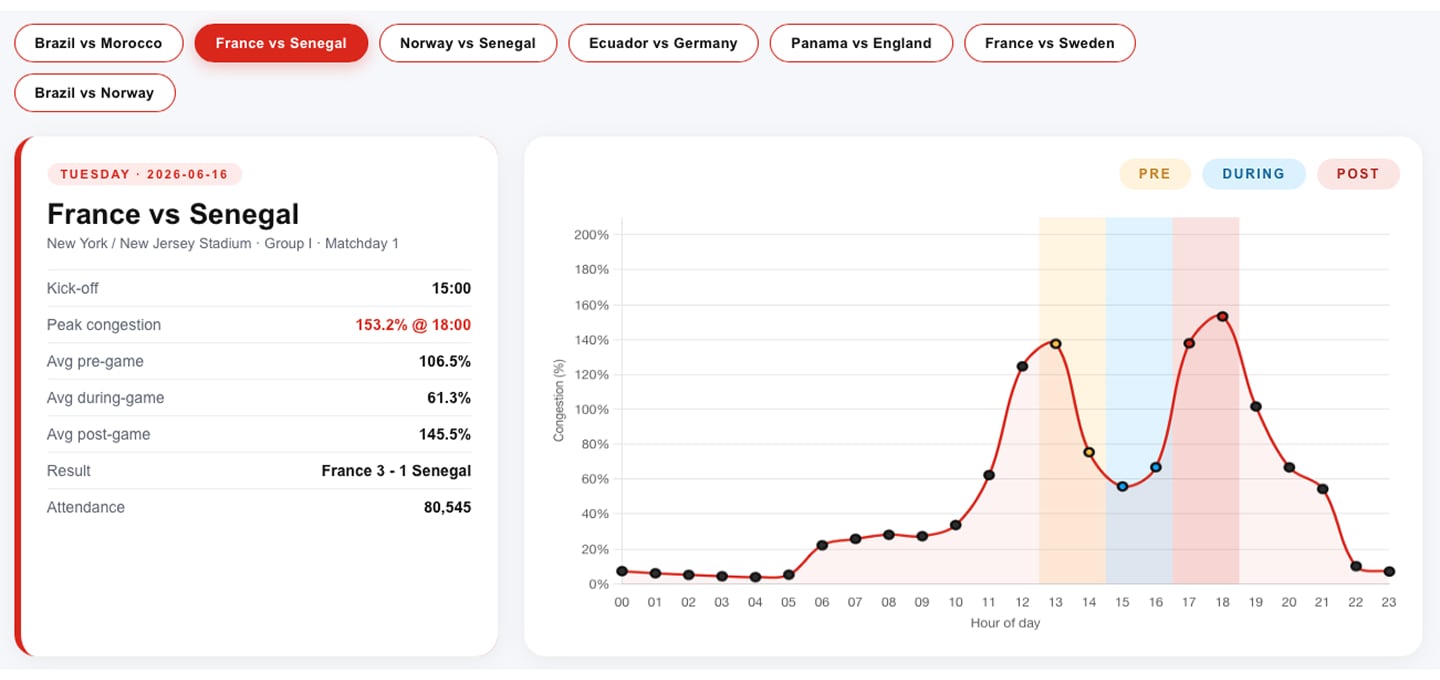 France vs Senegal recorded the highest post-match congestion, peaking at 153.2%. Explore the data.
And if you look at traffic conditions more than an hour after the final whistle of Norway vs Senegal, congestion still stood at 125.1%. This suggests that post-match congestion can be more persistent, slowing network recovery.
Managing spectator departures will be as important as managing arrivals — especially as a Final generates widespread celebrations and crowd movement. While arrival times tend to be naturally staggered — with early-arrivers offsetting latecomers — post-match movement is concentrated around a single moment: the final whistle. Roads, public transport, ride-hail services, parking facilities and drop-off zones all come under pressure simultaneously, particularly during a World Cup Final, where spectators may be more likely to remain until after the final whistle to experience the occasion in full.
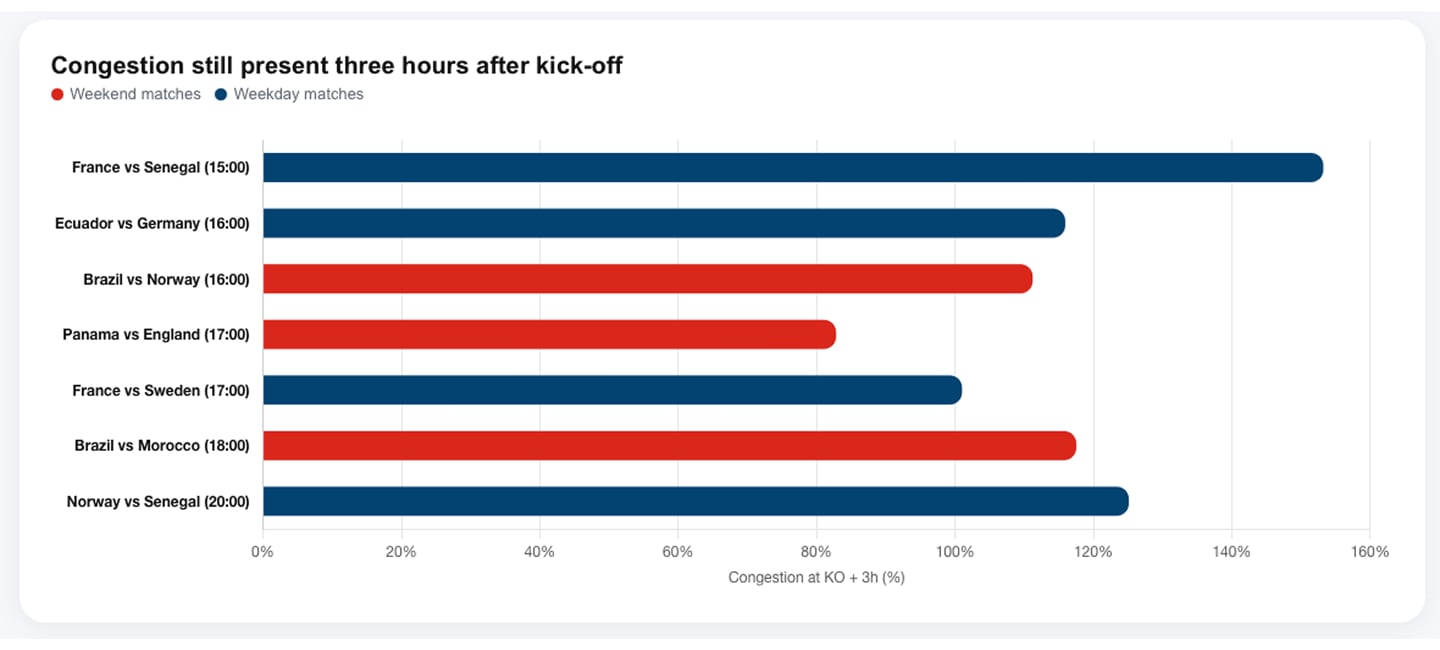 Congestion levels remained high over an hour after each match's final whistle. Explore the data.
Prediction 3: Kick-off time and day of the week will influence traffic
Each game presented its own unique congestion patterns based on both the hour of kick-off and whether it took place on a weekday or over the weekend.
Let's review a few of the key findings discussed so far: the Brazil vs Morocco match on Saturday recorded the highest congestion level across all matches analyzed two hours before its 18:00 kick-off. France vs Senegal, which started at 15:00 on a Tuesday, recorded the highest post-match congestion level. And Norway vs Senegal, kicking off at 20:00 on a Monday, was still recording high congestion over an hour after the match finished.
Each of these may well be influenced by how matchday traffic interacted with day-to-day travel patterns: weekend afternoon leisure and tourism, weekday evening rush hour and after-hours public transport availability.
More broadly, across the matches analyzed, weekend fixtures tended to produce stronger pre-match spikes, while weekday fixtures more often recorded higher post-match congestion.
So, what does this mean for the Final? Scheduled to kick off at 15:00 on a Sunday, the match is likely to generate traffic that will overlap and contend with existing weekend travel patterns both before and after the event.
Before kick-off, spectators traveling to MetLife Stadium will be sharing the network with regular midday weekend traffic across New York and New Jersey. After full-time, traffic from the stadium will coincide with evening leisure, tourism and waves of departees from other spectator areas, such as fan zones, as crowds head into post-match celebrations.
The result is a distinct mobility profile shaped not only by the match itself, but by how event traffic interacts with broader weekend activity across one of the world's busiest metropolitan regions. Understanding Sunday’s hour-by-hour travel patterns at this time of year will help road authorities and transport providers determine where and when issues are likely to arise.
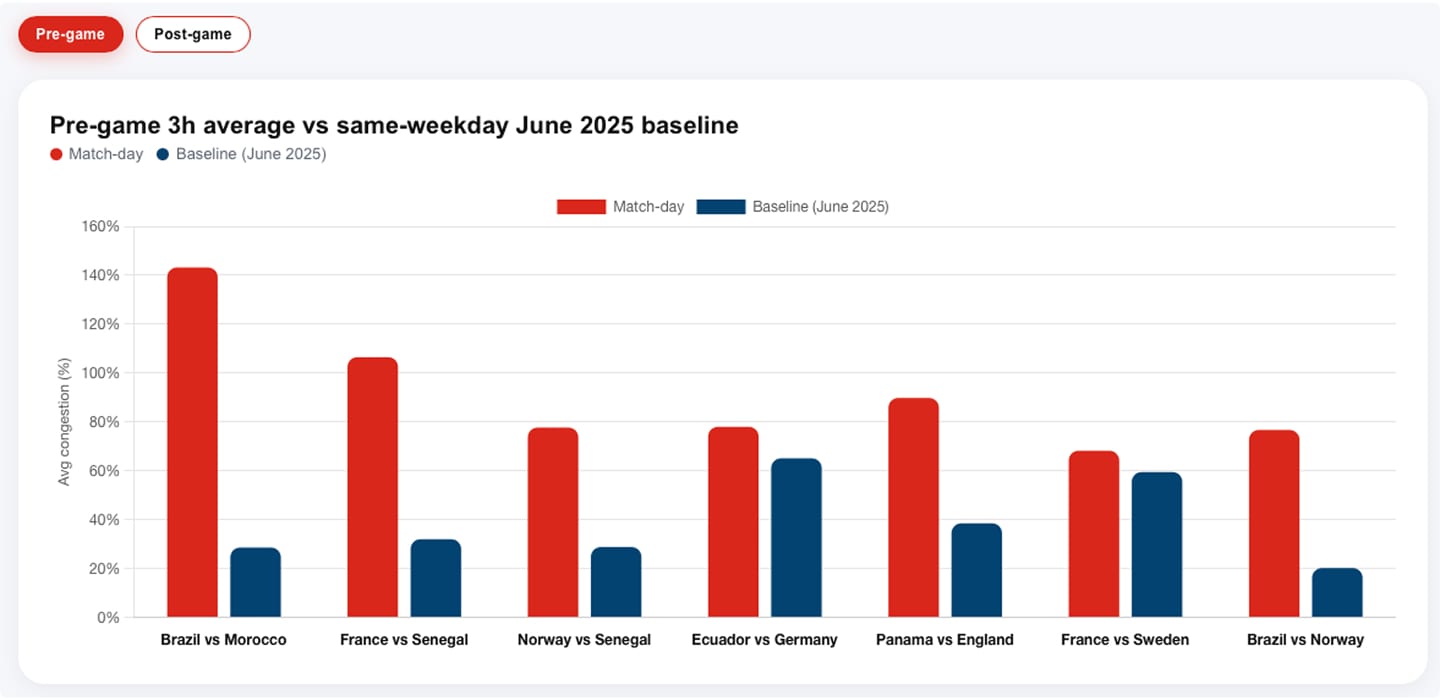
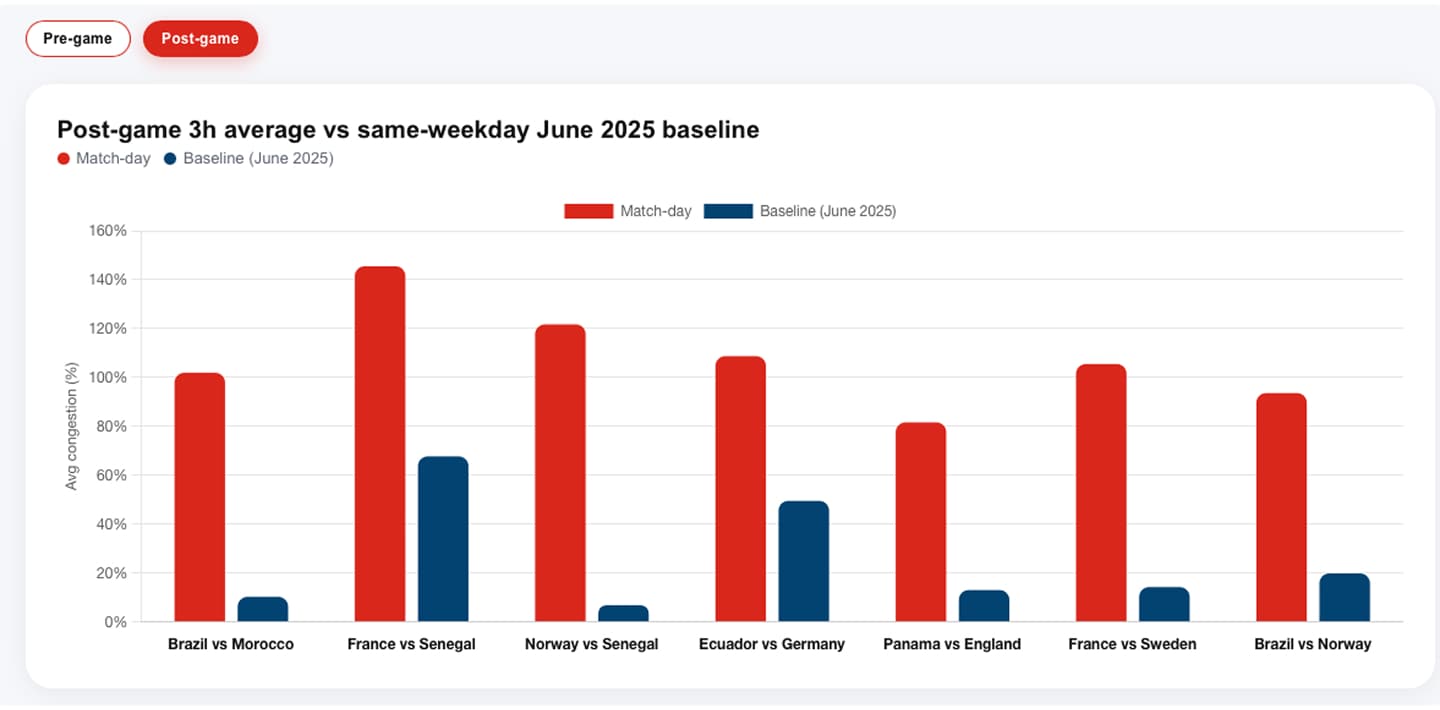 These two graphs illustrate the impact of match-day traffic by comparing congestion levels on match days with typical congestion levels at the same times one month earlier. Explore the data.
A few contextual considerations
It’s important to note: these findings are a starting point — they don’t determine exactly how traffic will behave on Final day, but they do provide a strong indication of where pressure is most likely to build and which patterns operators should prepare for. It’s also important to weigh up the unique context of a World Cup Final when interpreting these findings.
The Final will be larger than any of the matches analyzed. Additional media activity, security operations and infrastructure constraints across the entire city are all likely to influence traffic conditions beyond what's been observed so far.
But higher stakes don’t always mean higher congestion levels. As the tournament progressed from the group stage to the knockout rounds, congestion levels did not consistently increase. In fact, traffic conditions for the round-of-32 match France vs Sweden and round-of-16 match Brazil vs Norway were better than the first two group-stage matches.
This indicates that bigger matches are not necessarily preordained traffic disasters.
The Final’s mobility footprint will also extend beyond MetLife Stadium itself. Attendance at every match has been high, with the venue almost at capacity. So additional fans may not translate into stadium-centric traffic but impact the city at large, spreading pressure across fan zones and various event-related activities throughout New York.
Whoever reaches the Final could also impact road conditions. For example: teams whose supporters can easily travel to New York may result in an uptick in weekend tourism. And the city’s international population means some teams are likely to have stronger local support than others. Understanding how different fanbases move throughout a tournament could provide additional planning insights beyond stadium attendance alone.
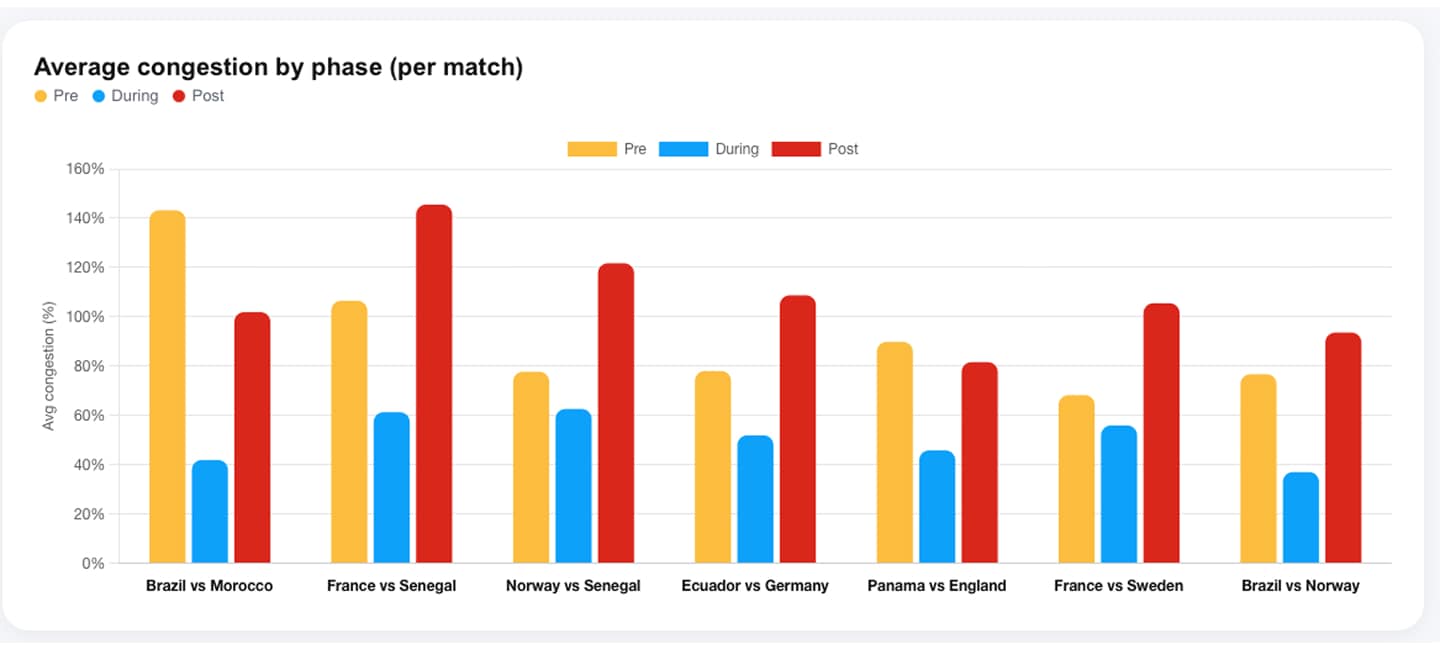 Across all seven games, post-match traffic drove the day's peak congestion, with levels after the final whistle surpassing all other time periods. Explore the data.
Putting the data to work
This is a top-level snapshot of what the traffic data shows us. When combined with use case-specific expertise and datasets, it provides key decision-makers with up-to-the-minute mobility intelligence. For example:
Public transport operators: Network visibility helps identify where pressure is building and when additional capacity may be needed. Congestion patterns around key corridors, bridges and transport hubs support decisions around service frequency, routing and passenger management.
Traffic management centers: Live traffic feeds, incident information, route monitoring and accurate travel times help operators understand where to anticipate congestion, where pressure is emerging and which alternative routes remain viable. It also helps operators manage traveler expectations with accurate travel information communicated through digital signage and route guidance systems.
Emergency and event response teams: Understanding where route reliability is deteriorating helps emergency and response teams position resources where they're most likely to be needed. Incidents at previous events also provide crucial context around which roads and junctions are most likely to experience pressure, helping teams plan contingencies before issues arise.
A mobility challenge unlike any other
No two major events are identical, and the World Cup Final will undoubtedly introduce variables that no dataset can fully predict. But the patterns observed across the seven matches played at MetLife Stadium provide a strong starting point — highlighting likely pressure points, operational challenges and opportunities to adapt as conditions evolve.
To dive into the data yourself, explore the TomTom Move Portal. Our suite of analytics tools delivers rich traffic insights and mobility data via ready-to-use reports and data visualizations.
Alternatively, check out our interactive World Championship Traffic Index dashboard. Covering all 16 host cities, the dashboard provides live traffic updates around each stadium. It also now includes a traffic intelligence tool that demonstrates how AI draws on live and historical data to analyze changing conditions and support time-critical decisions across a range of industries and use cases.
People also read
)
)
)
)
* Required field. By submitting your contact details to TomTom, you agree that we can contact you about marketing offers, newsletters, or to invite you to webinars and events. We could further personalize the content that you receive via cookies. You can unsubscribe at any time by the link included in our emails. Review our privacy policy. You can also browse our newsletter archive here.