)
Every day, millions use the roads to get to their destinations. Despite advances in vehicle technology, emergency response and roadway design, drivers and passengers continue to be vulnerable. As the way we move changes, traditional safety approaches can’t keep up with evolving risks. Today, agencies are turning to smarter, data-driven approaches — using real-time insights to spot dangers before incidents happen and build safer, more resilient transportation networks. Around the world, cities have seen that with the right data and proactive strategies, Vision Zero is within reach.
Every year, over 1 million people are killed on roads around the world, while millions more sustain life-changing injuries. Considering that the annual death count in other modes of transit such as planes and trains is much lower, it's alarming and concerning that the state of safety on our roads has become so normalized.
In 1997, Sweden launched its ‘Vision Zero’ strategy with the goal that no one should be killed or seriously injured in a road accident. This approach also aims to make mobility safer, healthier and more equitable by shifting the responsibility of road safety from individual users to those that design transit networks. Since its inception, countries around the world have increasingly adopted this strategy.
 Using its Vision Zero strategy, Sweden hasn't just made its roads safer but also made the country more accessible and livable for all its residents.Despite evolving measures, the impact has been slow. While traffic deaths in the U.S. began to fall since the adoption of Vision Zero in 2014, the COVID-19 pandemic years saw a significant rise in fatalities. Across Europe, rising numbers of cyclists and micromobility users have contributed to the number of vulnerable road users. In the Middle East, rapid growth has created new safety risks.
Agencies face increasing pressure to make mobility safe and efficient — and further evolve their approach from reactive crash response to proactive risk management. To achieve this, road authorities need innovative strategies to detect and measure danger on our roads. With modern movement data on factors like speed patterns, agencies can better identify emerging risks, understand behavioral change and measure the impact of safety investments.
So, how, with all the technology, data and insight at our disposal today, can we accelerate our journey to Vision Zero? This article looks at how cities across the globe are approaching their journey to Vision Zero and building proactive frameworks supported by versatile data sources such as TomTom’s movement intelligence.
The starting points on the journey to Vision Zero
Countries around the world take different approaches to Vision Zero, but most follow elements from four strategic approaches.
Reactive vs. Systemic
Reactive strategies rely on information collected about road-traffic collisions, or crash data, to identify problem areas. While informative, this approach can delay interventions until after harm has occurred. By its nature, this approach needs road traffic incidents to happen before problem areas can be identified. The alternative is to pursue a systemic approach, like Stockholm and Amsterdam. These interventions target risk factors such as speed and road design in anticipation of crashes and other incidents.
Enforcement vs. Engineering
While enforcement relies on policing and automated cameras to change behavior, engineering physically reshapes streets to reduce speeds and conflict points. Dubai leans on high-tech enforcement, whereas Amsterdam and Stockholm favor street redesigns. London blends both approaches.
Throughput vs. Safe systems
Traditional planning prioritized vehicle throughput, or moving vehicles quickly through a stretch of road. Vision Zero flips the script, putting human safety first even if it means slower travel for drivers. European cities like Paris lead this shift, while New York City takes a more hybrid approach.
Lagging vs. Leading indicators
Strategies can also be built using indicators that lag or lead. Lagging indicators, like crash reports, identify where problems have already happened. Leading indicators, like speed patterns, help agencies spot risk before accidents arise. With movement data, cities can monitor these signals across their entire network, enabling faster, smarter and more targeted interventions.
The limitations of crash data
Traditionally, road safety strategies have depended heavily on crash data gathered from incidents. Because serious crashes are rare and unexpected, dangerous locations can go unnoticed until tragedy strikes. At the same time, minor crashes often go unnoticed and unreported, especially on more remote roads or in lower income areas, making it harder to perform precise crash analysis.
Crash reports also focus on outcomes of incidents, instead of the behaviors that cause them — like speeding, unsafe passing, sudden braking or poor road design. Needing to be collected over years to reveal significant patterns, crash-based approaches take up valuable time agencies don’t have.
To realize Vision Zero, agencies need techniques to evaluate the impact of measures like speed limit changes, enforcement or roadway redesigns. This is where insights into how people actually use roadways prove invaluable. With TomTom data, agencies can examine corridor performance, identify speed volatility and create a real-world picture of how conditions evolve after safety interventions, and importantly, before any serious incidents have occurred.
How cities around the world approach Vision Zero
Amsterdam
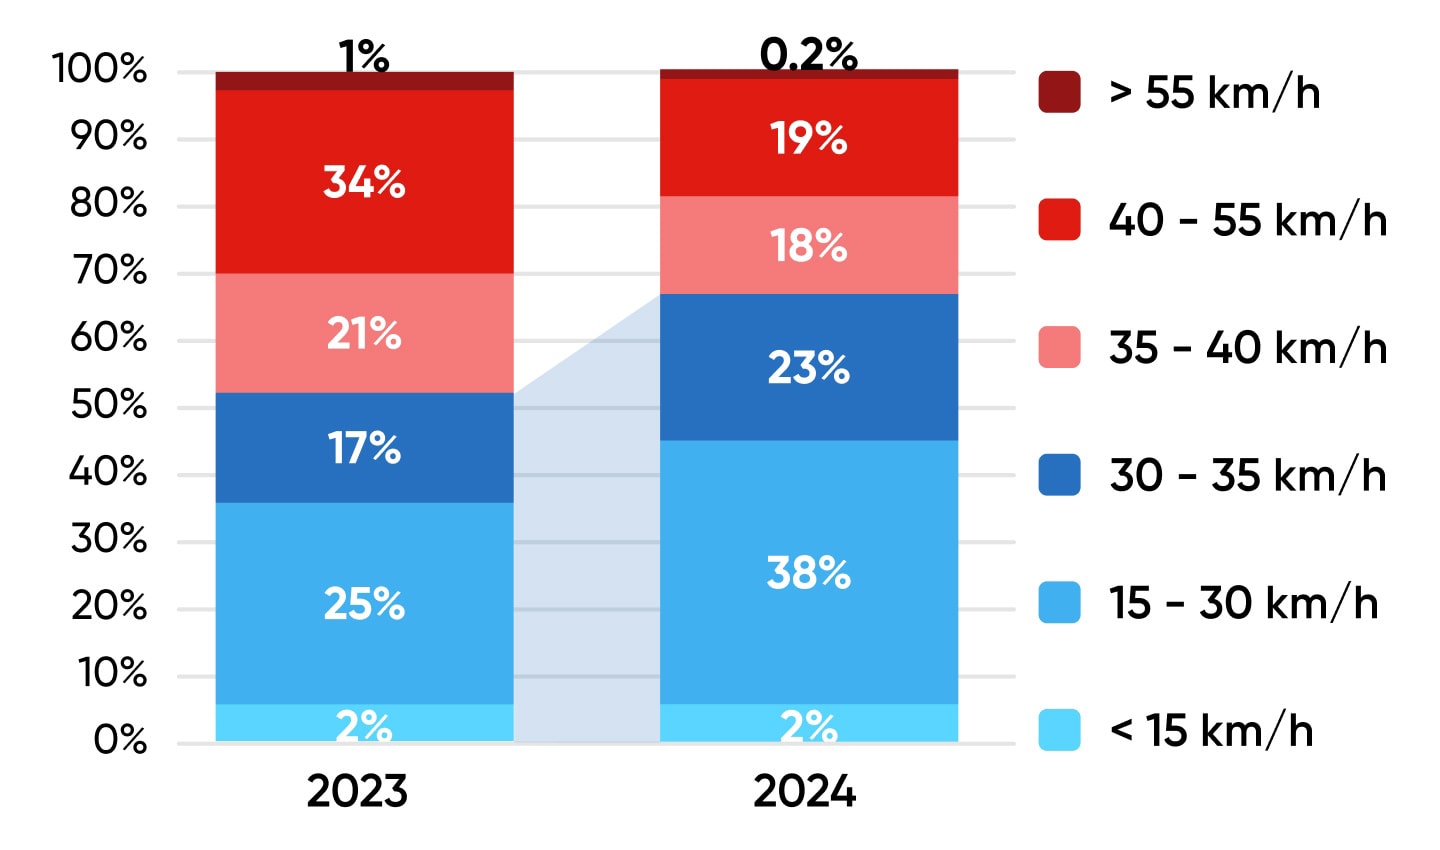
Today, Amsterdam’s transportation network is among the most multimodal in Europe. However, until the 50s and 60s, the city was car dominant, going so far as to knock down historic landmarks and entire suburbs to make space for roads. As this reliance on automobiles led to increased road fatalities (especially impacting children), activism combined with political events caused the city to commit to change and transform into the cycling capital of the world. Since then, the city has continually sought to make its roads safer. In 2023, Amsterdam implemented a default 30 kmph (~19 mph) limit on most distributor roads to reduce accidents and make the city more pleasant to live in for everyone.
The following measures were implemented:
- Approximately 4,500 road signs were installed.
- 140 traffic lights were reconfigured.
- Over 200 kilometers of road markings were changed.
This policy showed results fast. After the first year of it coming into effect, the following observations were made:
- Crashes on 30 kmph (~18.6 mph) roads decreased by 11%.
Average speeds reduced by 5%.
- Severe speeding declined from 1% to 0.2%.
Noise levels fell by around 1.5 dB.
- Bus travel times increased by only 13 seconds on a 10-minute trip.
- Tram journey times saw an insignificant increase of only three seconds.
- Emergency response times remained within threshold.
Overall average speeds fell by ~5% on all road classes — from 43.5 kmph (~27 mph) to 41.5 kmph (~25.5 mph).
Amsterdam is proof that reducing speed limits won’t slow cities down but can accelerate progress towards road safety and livability.
Dubai
The UAE, and other countries in the Middle East, already rely on real-time location data to maintain traffic and prioritize safety, especially when hosting big events. The rapid urban and industrial growth seen in big cities like Dubai has put even more pressure on the road network to accommodate the rising population and number of automobiles.
As per the Dubai Traffic Safety Strategy 2022-2026, the city aims to become one of the safest cities in the world and achieve zero road fatalities by 2026 — using strategic initiatives for traffic control, vehicle and highway engineering, traffic awareness, systems and management.
The city is relying on the following strategies to achieve its vision:
- Using AI intelligence and advanced radar feeds to identify critical traffic offenses in real time, including using a phone while driving and not wearing a seat belt
- Plans to adjust speed limits based on weather, traffic, events and roadworks
- Continual traffic corridor safety audits
Installing 210,000 road signs to provide advance warnings and cut crashes
1.8 fatalities per 100,000 people in 2024
90% drop in road fatalities since 2007
- Data shows that Free Flow speeds, or speeds during zero-traffic conditions, have gone from around 67 kmph (~42 mph) at the start of 2022 to 65 kmph (~40 mph), signaling a 3% reduction in speeds that isn't tied to congestion, but suggests an overall reduction in speeds.
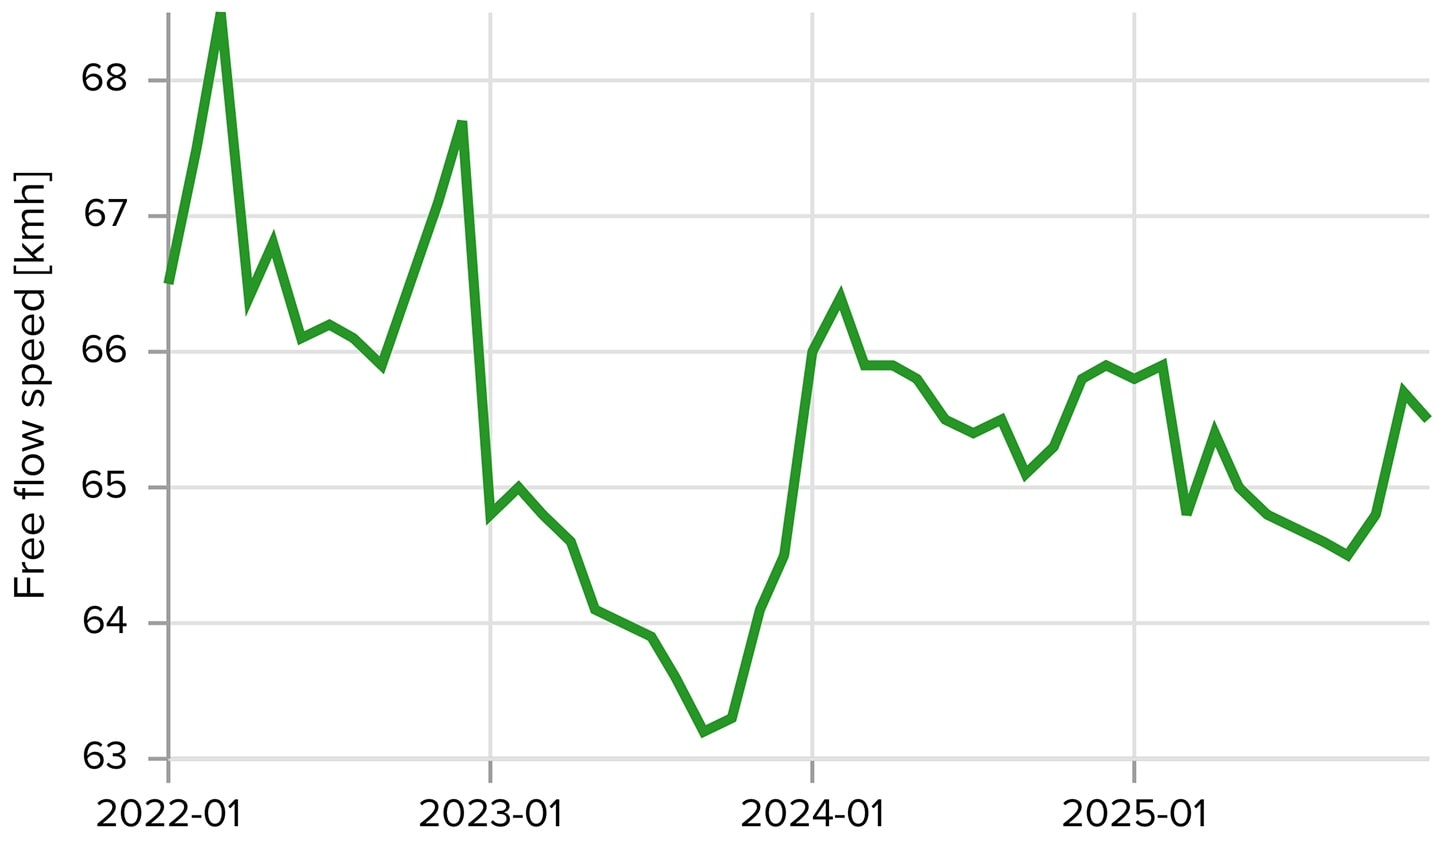 TomTom data shows that speeds during zero-traffic conditions have seen a 3% decline since the launch of the Dubai Traffic Safety Strategy in 2022.
Dubai exemplifies the impact technology-driven safety strategies and data-informed decisions can have on road safety.
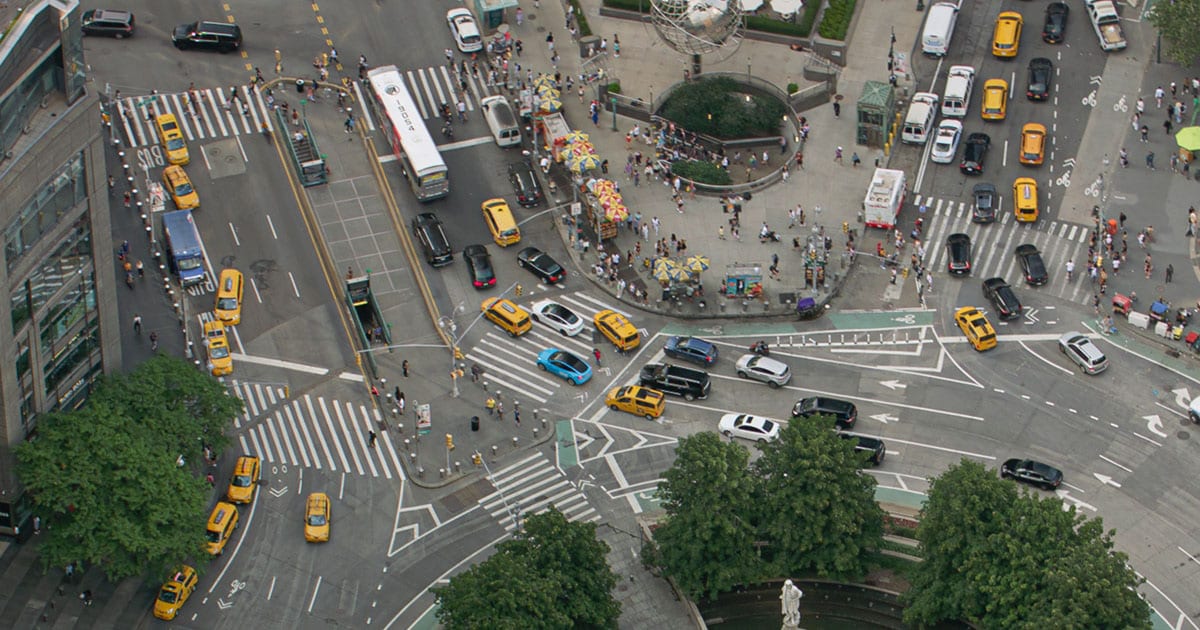
New York City
With a dense street network (spanning about 10,138 kilometers/6,300 miles) and large volumes of pedestrians, New York City faces serious challenges to making its roads safer.From 2021 to 2023, more than 200 people were killed in crashes where speeding was a major factor. Having adopted Vision Zero in 2014, the city relies heavily on data-driven strategies to guide its road safety efforts. Based on 2024 data, the TomTom Traffic Index ranked NYC the slowest-moving city in the U.S. In January 2025, it became the first city in the country to launch a congestion pricing program, and over the course of the year, traffic appeared to improve.
NYC implemented the following measures:
Reducing the citywide speed limit from 30 to 25 mph
Introducing a fee — based on the time and duration of visit and vehicle type — to enter Lower Manhattan
Building a large-scale automated speed camera program to deter speeding
Major intersection upgrades and pedestrian-first designs
Together, these have shown great promise:
Average travel times improved by 3 minutes 5 seconds per 10 km.
Average speeds increased from 17.6 kmph (~11 mph) to 19.4 kmph (~12 mph).
Bus speeds improved on several major corridors.
Public transportation use increased on routes where reliability improved.
Overall traffic deaths declined by more than 12%, with pedestrian deaths decreasing by 45%.
Speeding reduced by 73% at camera locations.
- Injuries reduced by 14% in camera zones.
Repeat speeding violations dropped by 94% after three tickets.
New York City demonstrates that a data-driven approach to managing congestion and speed combined with automated enforcement can go a long way in making cities more efficient, safe and equitable, no matter where they started from.
Common policy measures
These case studies show that a combination of policy approaches can help authorities significantly reduce road fatalities. Below are policies that helped in the explored cases:
Speed management: While often the most divisive initiative, speed limit reductions prove highly effective. Using speed data, agencies can easily monitor the compliance and impact of these policies.
Automated enforcement: Using data-informed targeting, speed cameras and AI systems can help cities reduce violations and promote safer driving behavior.
Roadway redesign: Roads can also be made safer by allocating space for vulnerable road users using engineering solutions such as narrower lanes, curb extensions and protected bike lanes.
Data-driven targeting: Combining crash history with behavioral data, a holistic picture of danger can be created to optimize and direct investment decisions.
Traffic data: From Vision Zero to vision hero
With high-quality movement data, transit agencies can understand speed patterns, detect risks and evaluate the impact of policy interventions with pinpoint accuracy and undeniable reliability. As an addition to traditional crash reporting, TomTom’s leading movement data provides behavioral insights that enhance safety planning and support a comprehensive, proactive Vision Zero strategy.
Data can help in the following ways:Origin-Destination Analysis can be used to identify emerging risk locations and understand how changes in the road network impact movement.
Traffic Stats can be used to monitor compliance with speed limits, identify where speeds are volatile and gain a more comprehensive picture of on-road conditions.
Route Monitoring track changing road conditions in real time and keep drivers updated, ensuring safety.
Junction Analytics to get insights into speed volatility at critical points in the network and support proactive safety planning.
Reaching Vision Zero: A proactive approach to safety
The examples illustrate the global commitment to eliminate traffic fatalities and severe injuries. And they show how different approaches can lead to safer streets.
Cities like Amsterdam, Dubai, New York and more underscore how systemic design, smart enforcement and modern, data-driven safety planning can contribute to sustainable, meaningful progress. Although traditional reactive tools like crash data continue to be important and impossible to ignore, dynamic movement data can further strengthen Vision Zero approaches with proactivity and intelligent insights. By infusing movement data into safety planning from the outset, agencies can detect risks earlier, evaluate interventions faster and more effectively create safer street networks for all road users.
People also read
)
The global traffic challenge in numbers: What the TomTom Traffic Index data tells us
)
Building road network resilience: How to keep moving through disruption
)
Roads to efficiency: Data-driven transport planning in New York, Texas and California
)
[Long read] TomTom’s City of the Future: A vision for smarter, more livable urban spaces
* Required field. By submitting your contact details to TomTom, you agree that we can contact you about marketing offers, newsletters, or to invite you to webinars and events. We could further personalize the content that you receive via cookies. You can unsubscribe at any time by the link included in our emails. Review our privacy policy. You can also browse our newsletter archive here.