)

For more than 15 years, the TomTom Traffic Index has monitored the health of our roads, capturing its minute-by-minute pulse to assemble a year-long overview of how vehicles have moved through hundreds of our world’s major cities. This year’s edition tells a painfully familiar story. As cities grow and journeys multiply, the challenge of managing city road networks continues to loom over municipalities, town planners and transit authorities. The Traffic Index confirms that keeping traffic moving has never been more difficult. How can we keep tackling such a challenge? With data, lots of data.
The numbers are in, and all over the world in 2025 we observe the overarching trend that congestion, by congestion level and travel time per kilometer, has worsened.
Major cities experienced increased travel times, including, London, England; Bengaluru, India; Dublin, Ireland; Mexico City, Mexico; Barcelona, Spain; Athens, Greece; Milan, Italy; Rosario, Argentina; Hiroshima, Japan; San Francisco, United States; and many others.
For another year, it shows just how universal vehicular congestion is.
Want to know more about the metrics and how the study was conducted?
It would be significantly quicker to list the cities where travel times have improved and decreased compared to 2024. Of the nearly 500 cities reviewed in 2025, just 34 saw reductions in their inner-city travel times per kilometer compared to a year earlier.
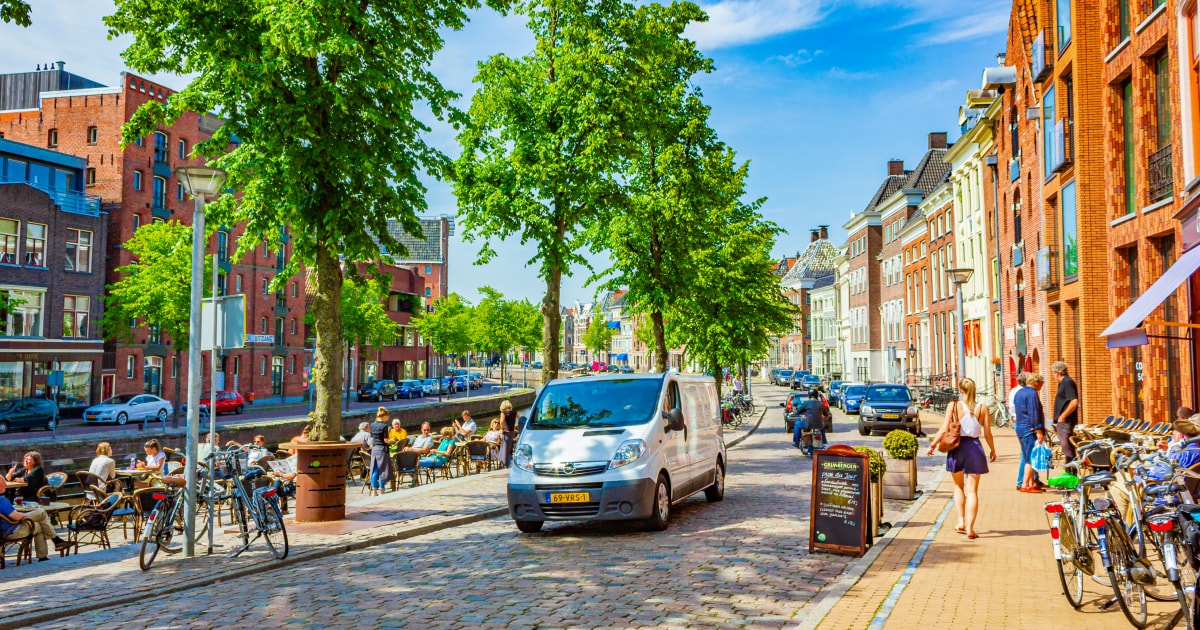 A busy street in Groningen, NetherlandsBut traffic isn’t just about speed, it’s also about flow. Considering the data with flow in mind, we see a potentially more positive story for some cities. The Congestion Level* improved in 125 cities, suggesting that traffic flowed slightly better in these cities in 2025 than it did in 2024.
[*Congestion Level measures how much traffic slows down a road network by comparing ideal freeflow travel times with realworld average travel times, expressed as a percentage. Changes in infrastructure, speed limits and volume of vehicles can affect this measure. Read more on the methodology page.]
Groningen, Netherlands; Kiel, Germany, New Orleans, U.S.; Paris, France; Rome, Italy; Mumbai, India and Riyadh, Saudia Arabia experienced a decrease in their congestion levels ranging from 23% to 5% respectively.However, this data shouldn’t be viewed in isolation. Many cities have recently lowered speed limits, added cycle lanes and upgraded infrastructure to support more ways of moving through their transit network. These changes can increase free-flow travel times for vehicles by shifting focus away from road traffic. If actual travel times stay the same while free-flow times rise, congestion levels will appear to decrease — not because roads are moving faster, but because infrastructure changes have reduced the difference between freeflow and actual travel times.
Of the 125 cities that improved congestion, just 24 reduced their average travel time per km. And only 11 reduced their free-flow travel times. So, while their reduction in congestion is a positive sign for overall travel in their transit networks, for drivers, it might not be such an improvement. Here's how congestion in the morning rush hour changed through 2025 in Groningen, Netherlands; Kiel, Germany and New Orleans, U.S.When examining traffic in individual cities, it’s important to consider the data with full context. Traffic flow and congestion, while being a universal challenge, is different from city to city.
Cities where traffic improved
In Sapporo, Japan, traffic appears to be easing. The Hokkaido city experienced the single worst day of traffic in 2024, thanks to inclement weather. In 2025 though, it saw a small reduction, of one second per km, in average travel time.
In Europe, Groningen, Netherlands, and Kiel, Germany, saw the largest improvements in their per km travel times, with reductions of 14 and 10 seconds respectively. Traffic also moved a little faster in Paris and Toulon, France, seeing a reduction of five and four seconds per km, respectively. Perhaps the most noteworthy city among this small group though is New York, United States. The concrete-canyoned metropolis saw a 1% (two second) reduction in per km travel time over 2025. While that might not sound like much, to see any reduction in travel time in one of the busiest cities in the world is worth examining.The city has been waging war on congestion in recent years, introducing a congestion charge for downtown Manhattan and improving cycling infrastructure to broaden the modal split of journeys and get people out of their cars.
Indeed, over the first half of 2025 the changes seemed to be making a notable impact, with the average congestion level over the first half of the year dropping to 45.6 from 46.9 compared to the same period a year earlier. This positive change might not last much longer, though. Traffic trends over the second half of 2025 indicate that congestion is worsening. And it could be worse than it was in 2024. The average Congestion Level in New York in the second half of 2025 was 51.3, across the same period in 2024 it averaged about 1 percentage point less at 50.4. How the congesting pricing impacted congestion in New York City in 2025While New York may have made a small but noteworthy impact on traffic, enough to register as an improvement across the whole year, it looks like it’s going to have to keep the pressure on in 2026 if it’s going to keep congestion from returning to its iconic streets and avenues.
The world's slowest city centers
When it comes to city centers with the worst travel time per km, we see a diverse top three featuring cities from South America, Europe and South Asia. Top of the list is Barranquilla, Colombia, where it takes 3 minutes 40 seconds to travel one kilometer — 2 seconds more than in 2024. During free-flow state, it would take 2 minutes 15 seconds, giving it a congestion level of 62.2. London is again the slowest city in Europe. It saw its average per km travel time rise 4 seconds from 3 minutes 34 seconds in 2024 to 3 minutes 38 in 2025. Its congestion level rose from 50.6 to 51.6. With free-flow travel times increasing by 1 second from 2 minutes 22 to 2 minutes 23 per km. This could suggest that changes to infrastructure do not improve outright travel times for cars, as free-flow state did not improve. The rise in Congestion Level further suggests that England’s capital is not improving the flow of vehicles through its inner-city corridors. 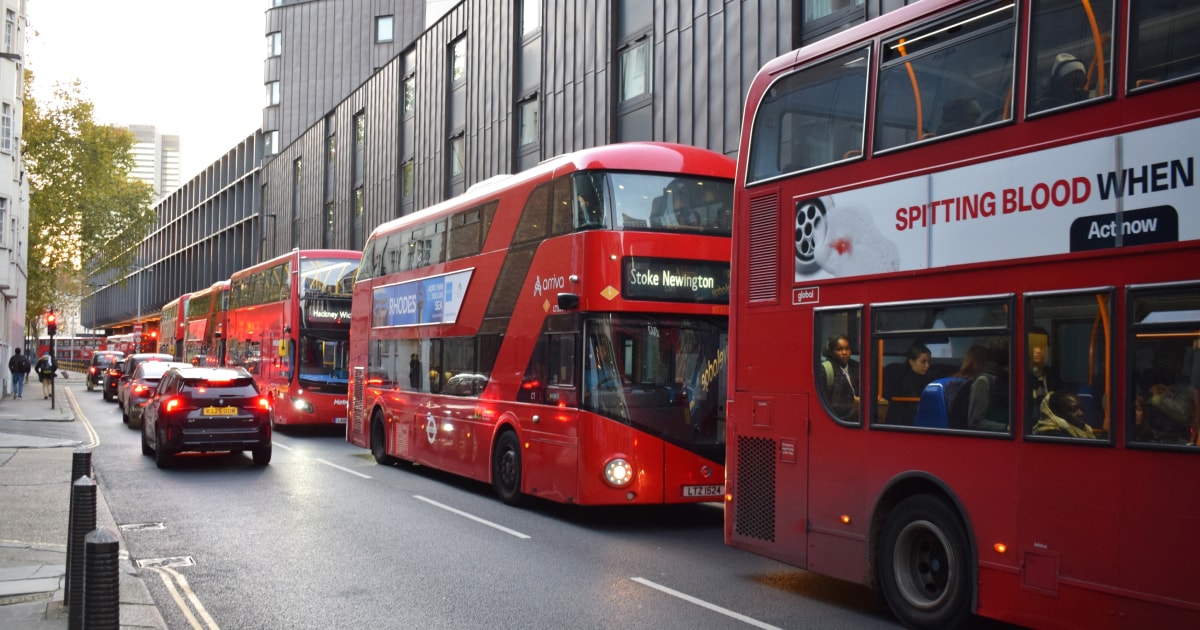
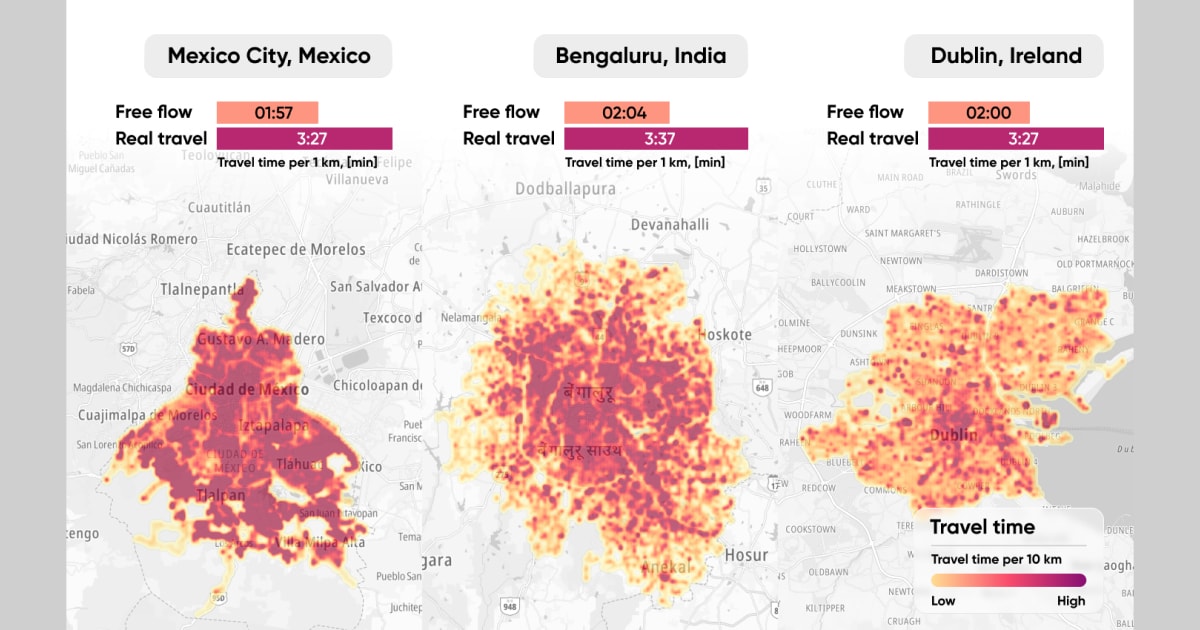
In Asia, India’s Bengaluru, is once again featuring as one of the slowest cities in the world. Average travel times here are 3 minutes 37 seconds per km. During free-flow state however, travel times are dramatically lower at 2 minutes and 4 seconds. Due to the significant slowdown during peak times, Bengaluru also features as the second-most congested city in the world by congestion level with a score of 74.4, up from 72.7 a year earlier.
The most congested cities in the world
The most congested cities in the world, by Congestion Level*, might not be the slowest in absolute terms. But they may be just as, if not more, frustrating for drivers on the ground every day, as they are the cities that slow down the most as traffic fills up their streets.
[*Congestion Level measures how much traffic slows down a road network by comparing ideal freeflow travel times with realworld average travel times, expressed as a percentage. Changes in infrastructure, speed limits and volume of vehicles can affect this measure. Read more on the methodology page.]
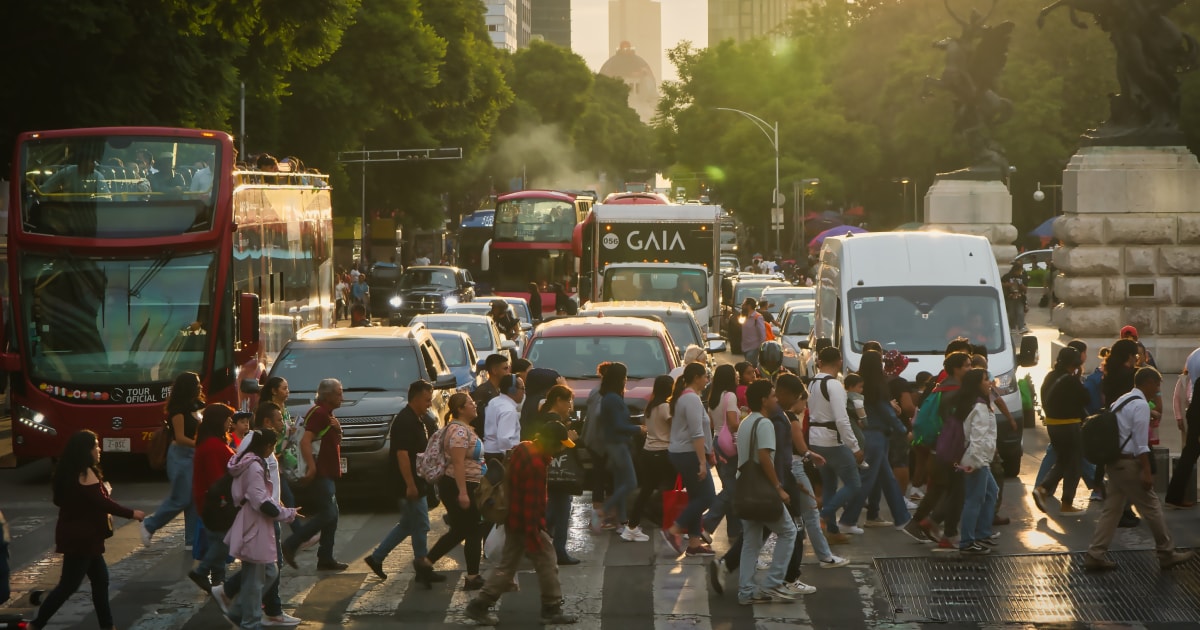 Mexico City, Mexico, ranks as the most congested city in this year’s Traffic Index, with a score of 75.9. Its free-flow travel time is just 1 minute 57 seconds per km, but its average real-world travel time is 3 minutes 27 per km. By travel time, it ranks seventh in the world.
 These cities epitomize the challenge of traffic and congestion and often feature highly on the Traffic Index. While traffic in these places ranks among the densest on Earth, there are many cities on much more alarming trajectories.
Cities that have slowed down the most
Several well-known cities across the Americas and Europe have seen their average real-world measured travel times increase in 2025 compared to 2024. The most significant was in Salto, Uruguay, where measured travel times increased by 12.3%, from 2 minutes 2 seconds per km to 2 minutes 17.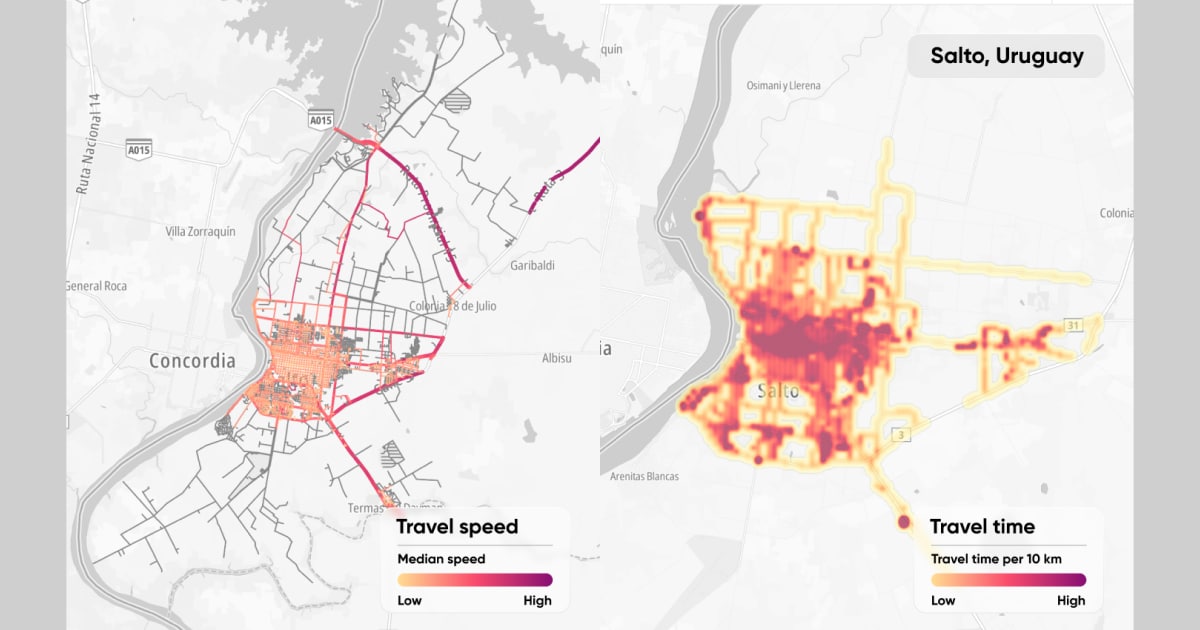 Three U.S. cities saw travel times worsen last year. Syracuse, Minneapolis and San Francisco each saw per km times increase by 8.9%, 6.9% and 6.6% respectively. In 2024 it took 1 minute 19 seconds to drive one kilometer in Syracuse; in 2025 that rose to 1 minute 26. In Minneapolis travel times rose from 1:12 to 1:17. And San Franciscans spent an extra 11 seconds in traffic, with per km times increasing from 2:47 to 2:58.
This is just a snapshot comparing the past two years. In some instances, increases in travel time could be the result of prolonged poor weather, world events or changes in infrastructure, such as road works or lowered speed limits — so they might not be permanent. If these increases are consistent year on year for these cities, it could be indicative of systemic and unchecked worsening traffic, or they might be short-term speed bumps as cities rebuild to improve vehicle flows long term. As universal a problem as traffic is, it’s different everywhere you go.
It's always the same, but it's always different
Los Angeles, U.S., is a perfect example of how important it is to dive deep into the data to truly understand how it impacts an individual city. With a score of 59.8, LA is the United States’ most congested city by congestion level, but its traffic still moves remarkably quickly. By travel time per km, it ranks 385 in the world, making it one of the fastest moving cities in this year’s report. In free-flow conditions it takes just 58 seconds to travel one kilometer; in traffic it takes just 1 minute 33 seconds — that’s more than 50% longer but still not a slow drive in absolute terms. It’s a similar situation in cities like Miami, Florida; Seattle, Washington; Houston, Texas; and Atlanta, Georgia. This is thanks to the fact that they have a high proportion of multi-lane highways in their center. 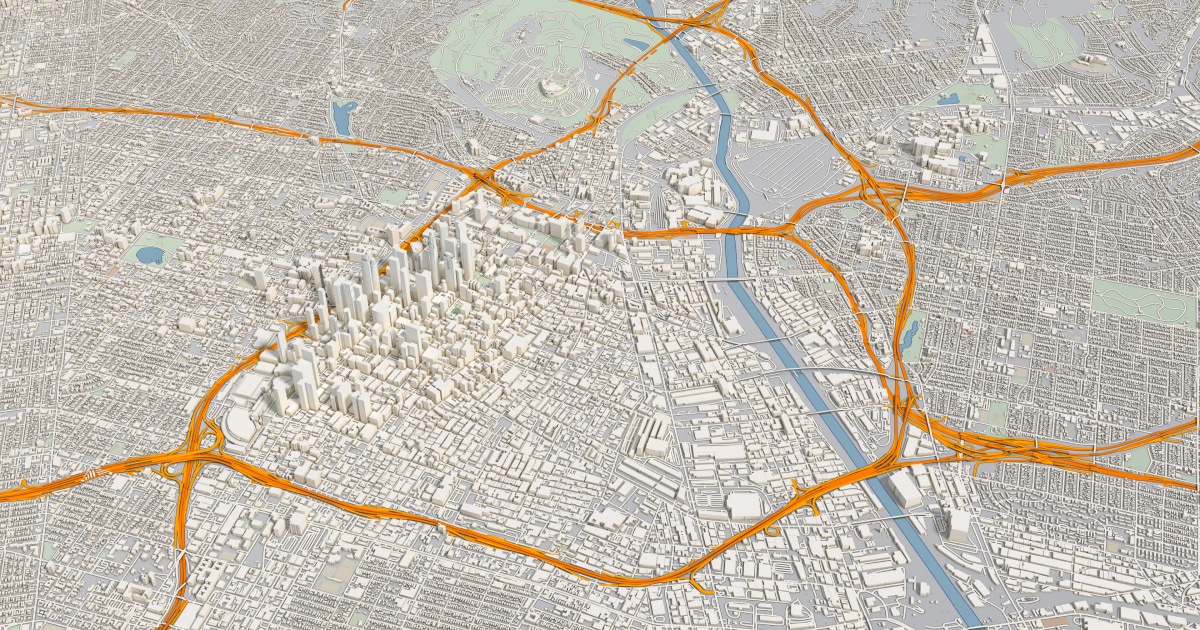 More than half the roads in the city center area of Los Angeles are highways (pictured here in orange).According to this year’s report, the City of Angels has a highway km ratio of 63%. In other words, more than half the roads in the city center area are highways. And when the average highway speed is nearly 60 kmph, it’s not surprising that speeds remain high and travel times remain low. But even so, they are still susceptible to congestion, suggesting that building more high-speed roads won’t solve congestion.
What about wider metropolitan areas?
So far, we have considered how traffic moves around city centers, focusing on the densest and often most challenging environments in which to manage traffic. But the Traffic Index also shows movements across the wider metro areas of each city. These are the areas that extend towards the outskirts of a city, capturing the suburbs, satellite districts and arterial roads. When we consider these areas next to city centers, we see that traffic, even across one city, can be differ dramatically, or it can be an even more widespread issue. For metro areas, congestion levels and speeds are calculated from averages across a much larger geographical area than the city center. When a metro area is congested and traffic moves slowly, there’s almost no escaping it unless you leave the entire city. By ranking by metro area we see a different list of cities by congestion level and travel time. Arequipa, Peru, has the world’s most congested metro area, with a score of 68.8. Here travel times per km are 1 minute 58 seconds in free-flow conditions and 3 minutes 27 seconds in traffic. The second and third most congested metro areas are in Bogota, Colombia, and Mumbai, India, with scores of 67.4 and 61.5 respectively. Bogota’s travel time per km in traffic is 2 minutes 54 seconds, 70 seconds more than in free-flow conditions. In Mumbai it takes 2 minutes 53 seconds to travel 1 km — 66 seconds more than in optimal flow. The city with the slowest moving metro area is also the city with the slowest moving city center, Barranquilla, Colombia. Here it takes 3 minutes 23 seconds to travel 1 km, just 17 seconds quicker than its dense city center. In this case, it shows just how widespread congestion is in Colombia’s Atlántico Department capital, spanning both center and metro areas to a similar degree. 
How bad was traffic in 2025
As was the case last year, traffic has continued to worsen. It moves slower in cities all over globe and, overall, most cities show an increase in congestion and travel times. However, cities around the world are adapting, changing, evolving and growing, using traffic data from TomTom to truly understand how traffic flows, finding pinch points and carrying out targeted data-driven infrastructure improvement projects. These initiatives are working but the challenge of traffic isn’t going to go away. As people flock to cities never designed to house such vast populations, traffic will continue to worsen unless cities act now, arm themselves with the right data and the most useful and trusted insights.
Want to learn how to make traffic flow in your city?
People also read
)
Building road network resilience: How to keep moving through disruption
)
Roads to efficiency: Data-driven transport planning in New York, Texas and California
)
The road to Vision Zero: How data can drive safer mobility
)
What the shutdown and holiday periods revealed about US airport traffic in 2025
* Required field. By submitting your contact details to TomTom, you agree that we can contact you about marketing offers, newsletters, or to invite you to webinars and events. We could further personalize the content that you receive via cookies. You can unsubscribe at any time by the link included in our emails. Review our privacy policy. You can also browse our newsletter archive here.