)

Transport networks are the complex circulatory systems of our cities, states and countries. When working well, they enable the economy, social connection and the movement of goods and services. But when a sudden disruption hits, whether it’s a flash flood, major event or infrastructure failure, these same systems can rapidly become a source of difficulty. Congestion escalates as mobility becomes most urgent, freight delays spread across supply chains and emergency vehicles struggle to reach people who need help most.
For governments, transport agencies and systems integrators tasked with planning and operating today’s road networks, the challenge of resilience is intensifying. Climate change, rapid growth and less predictable travel behavior multiply the complexity. There are more frequent and severe extreme weather events. Growing urban spaces and the constant demand on the infrastructure results in strained corridors. And mega-events or construction programs can dramatically alter network behavior for anywhere from days to months.
The key question isn’t only how to move traffic under normal conditions, but how to maintain safe, reliable mobility when conditions are anything but normal. The U.S. Federal Highway Administration has defined resilience as the ability to anticipate, prepare for and adapt to changing conditions and withstand, respond to and recover rapidly from disruptions. Achieving this requires a shift from reactive response to proactive, data-enabled planning and operations.
Resilience planning therefore requires a different kind of visibility — one that extends far beyond traditional sensors, cameras and loop detectors. This is where floating car data (FCD) is becoming a cornerstone of modern resilience frameworks.
From static monitoring to dynamic visibility
Most traffic management centers are built around decades of investment in fixed-sensor monitors: loop detectors, CCTV cameras and signal logs. These tools are valuable but limited. They’re fixed, expensive to deploy widely and leave large blind spots on local roads, diversion routes and rural networks.
During a major disruption, these blind spots matter. Travelers reroute onto secondary streets. Freight diversions reshape patterns across entire regions. Pedestrian and micromobility flows surge unexpectedly. Traditional sensors were never designed for this fluidity.
Floating car data fills these gaps. By aggregating anonymized GPS probe data from connected vehicles, navigation devices and mobile navigation apps, FCD produces a continuous, regionwide view of speeds, travel times, routing choices and delays, across nearly all road classes. Having access to such data in real time and historically, where no fixed sensors exist, is transformational for resilience planning.
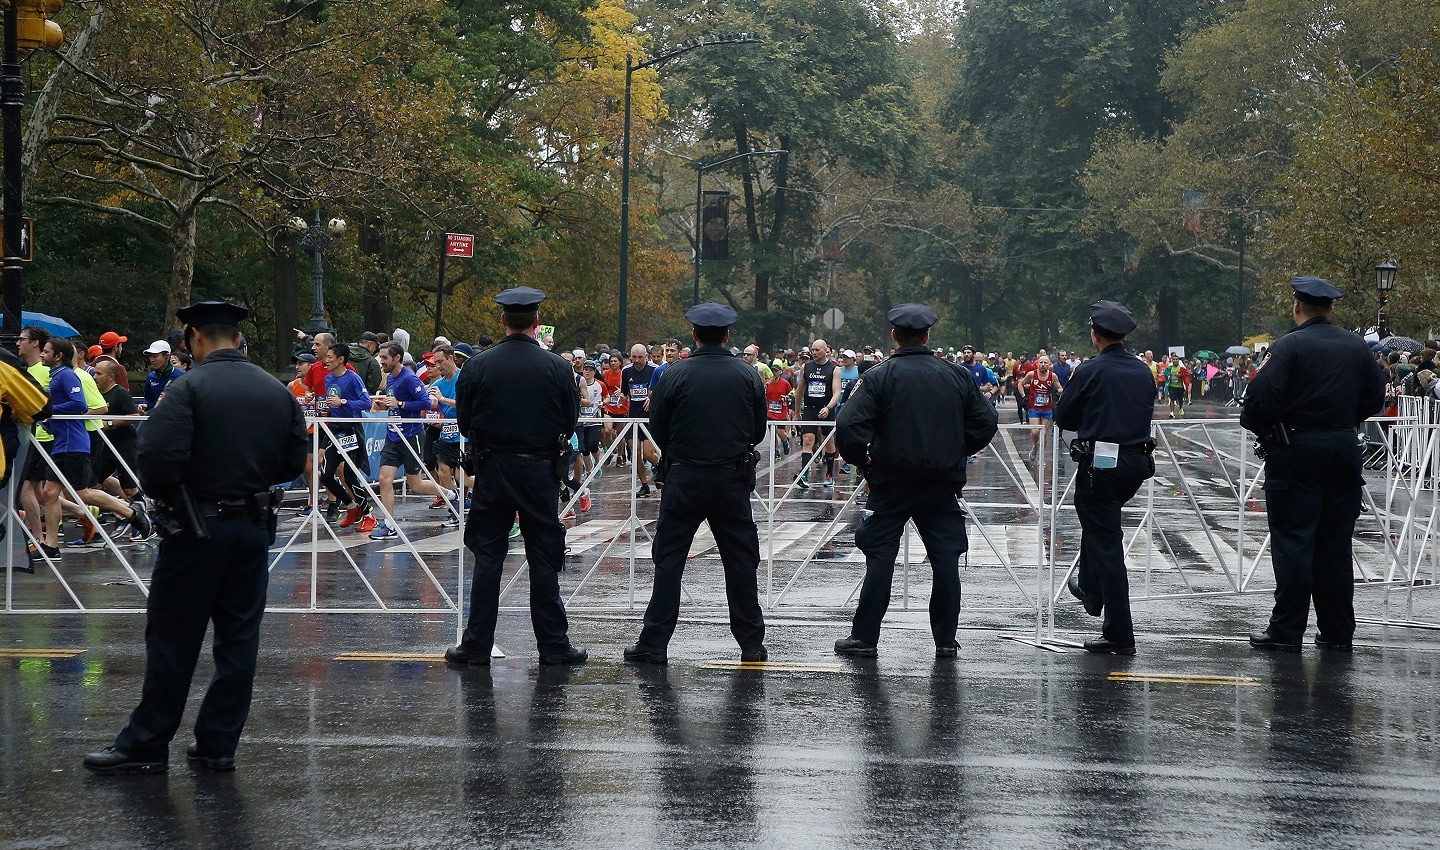 Cities managing events - Road closure
How floating car data strengthens road network resilience
For governments and planners, FCD powers a set of capabilities that directly support resilient operations before, during and after disruption.
1. Early anomaly detection
By comparing live speeds to historical norms, agencies can spot emerging issues like weather-related slowdowns, unreported crashes and rising queues — before they appear on CCTV or are called in by the public. This gives operators critical minutes to intervene, dispatch field crews or activate diversions.
2. Understanding travel intent through origin–destination flows
During emergencies, knowing where people are going matters as much as knowing how fast they’re moving. FCD-derived origin-destination (O/D) analytics reveal which communities depend on vulnerable infrastructure such as bridges, waterfront arterials or tunnels. Tools like TomTom O/D Analysis help planners identify which trips will be most affected by a closure and design more targeted response strategies.
3. Real-time corridor and junction monitoring
Every region has a handful of critical routes. These could be airport access roads, port approaches, evacuation corridors or major busways. Monitoring these with FCD allows agencies to track travel time reliability in real time. For more insight, platforms like TomTom Route Monitoring and Junction Analytics provide a hardware-free way to monitor queue formation, turn ratios and delay at priority intersections that could compromise diversion routes.
4. Before-and-after evaluation
FCD also enables post-event assessment: How quickly did the network recover? Which diversions worked? Where did reliability degrade? These findings help refine playbooks for future storms, events or evacuations.
5. Powering digital twins and predictive resilience
FCD serves as the empirical foundation for digital twins, i.e., a detailed virtual copy of a road network, traffic patterns or vehicle movement. This enables planners to simulate “what-if” scenarios like bridge failures, flood impacts or stadium events and test mitigations before the disruption occurs.
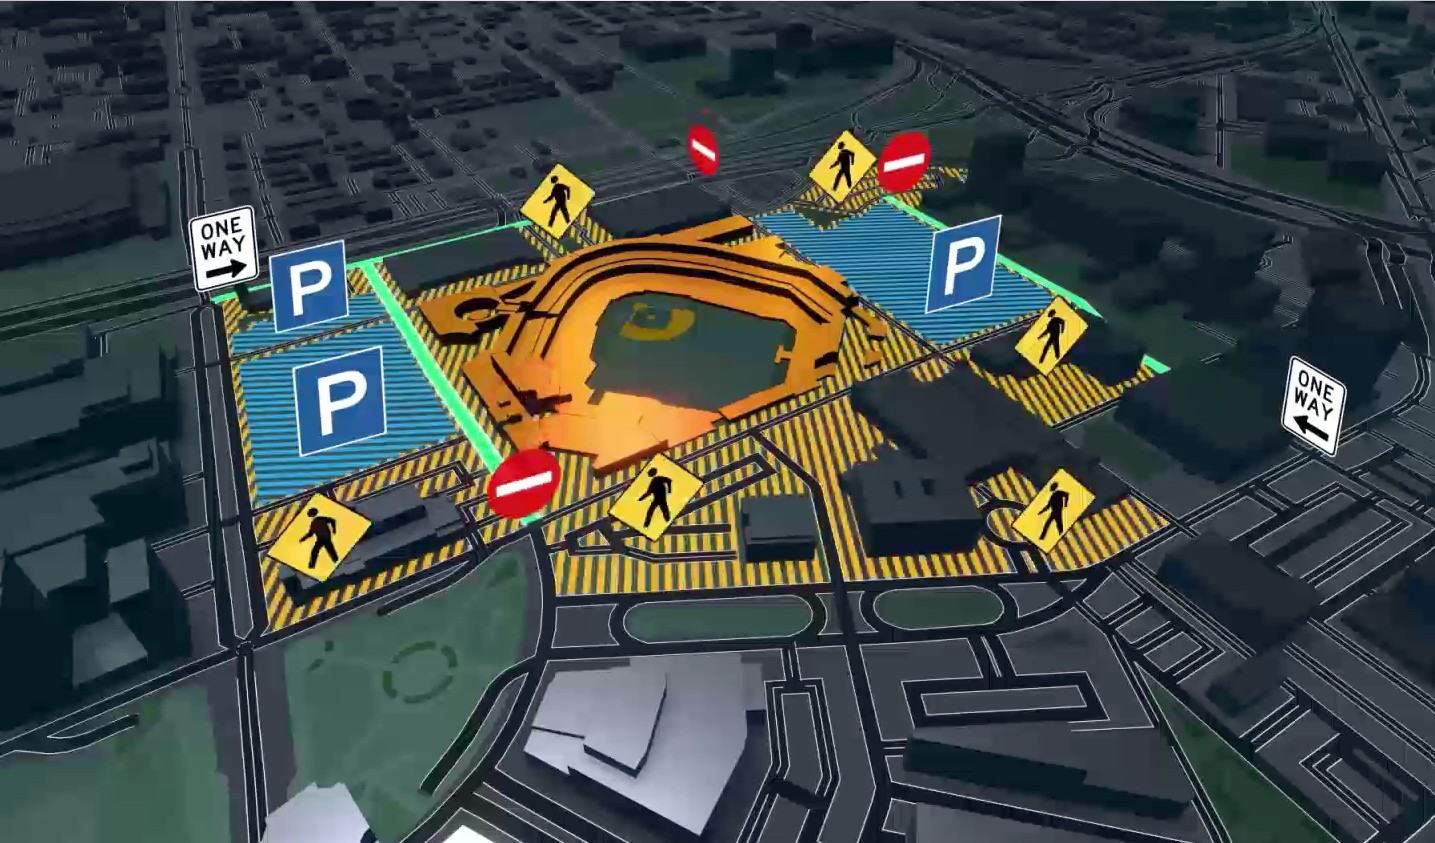 Stadium infrastructure planning
Resilience in the real world: Global lessons
Let’s look at how cities and agencies have used floating car data and digital tools to manage mega events, natural disasters and extreme weather.
Paris 2024 Olympics: Navigating a known disruption
Already one of Europe’s most congested cities, Paris faced a massive influx of visitors combined with extensive road closures and security cordons during the 2024 Olympics. In the weeks before the Games and on key ceremony days, several Seine bridges connecting the Left Bank and Right Bank were fully or partially closed, forcing traffic onto a reduced set of crossings and onto the ring road. Authorities needed to understand how these closures would reshape demand and to communicate realistic expectations to residents, visitors and freight operators.
Tools like TomTom Origin-Destination Analysis deliver insights to help understand. For example, looking at a comparison of the same time sets for four periods: a pre-Olympics baseline, the preparation week, the Games opening ceremony and the immediate post-Olympics window. The data shows central bridge segments dropping to almost zero probe counts when closed, with corresponding increases in travel times and volumes on the remaining open crossings and on the ring road.
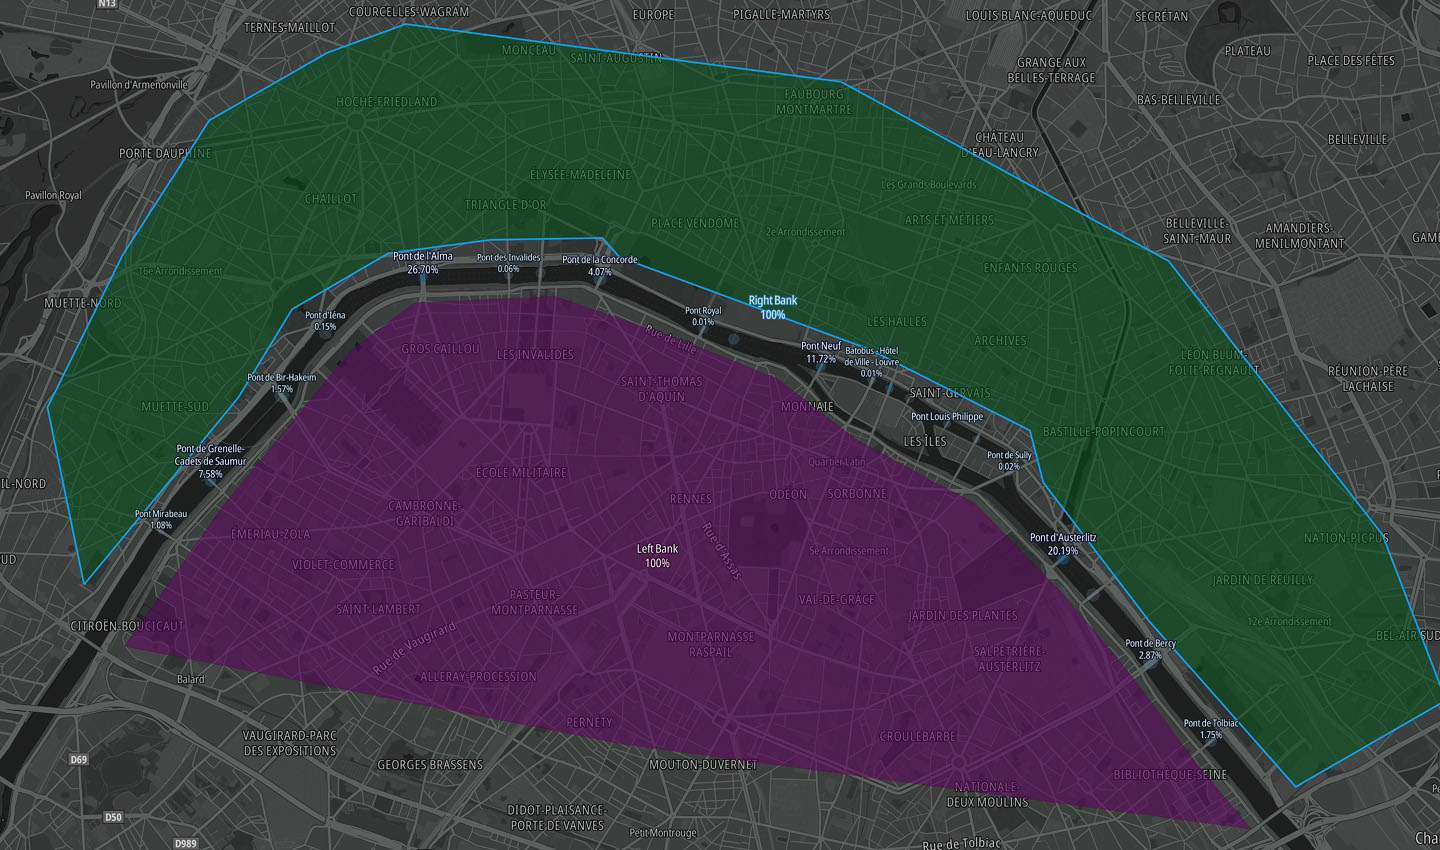 Paris Olympics map
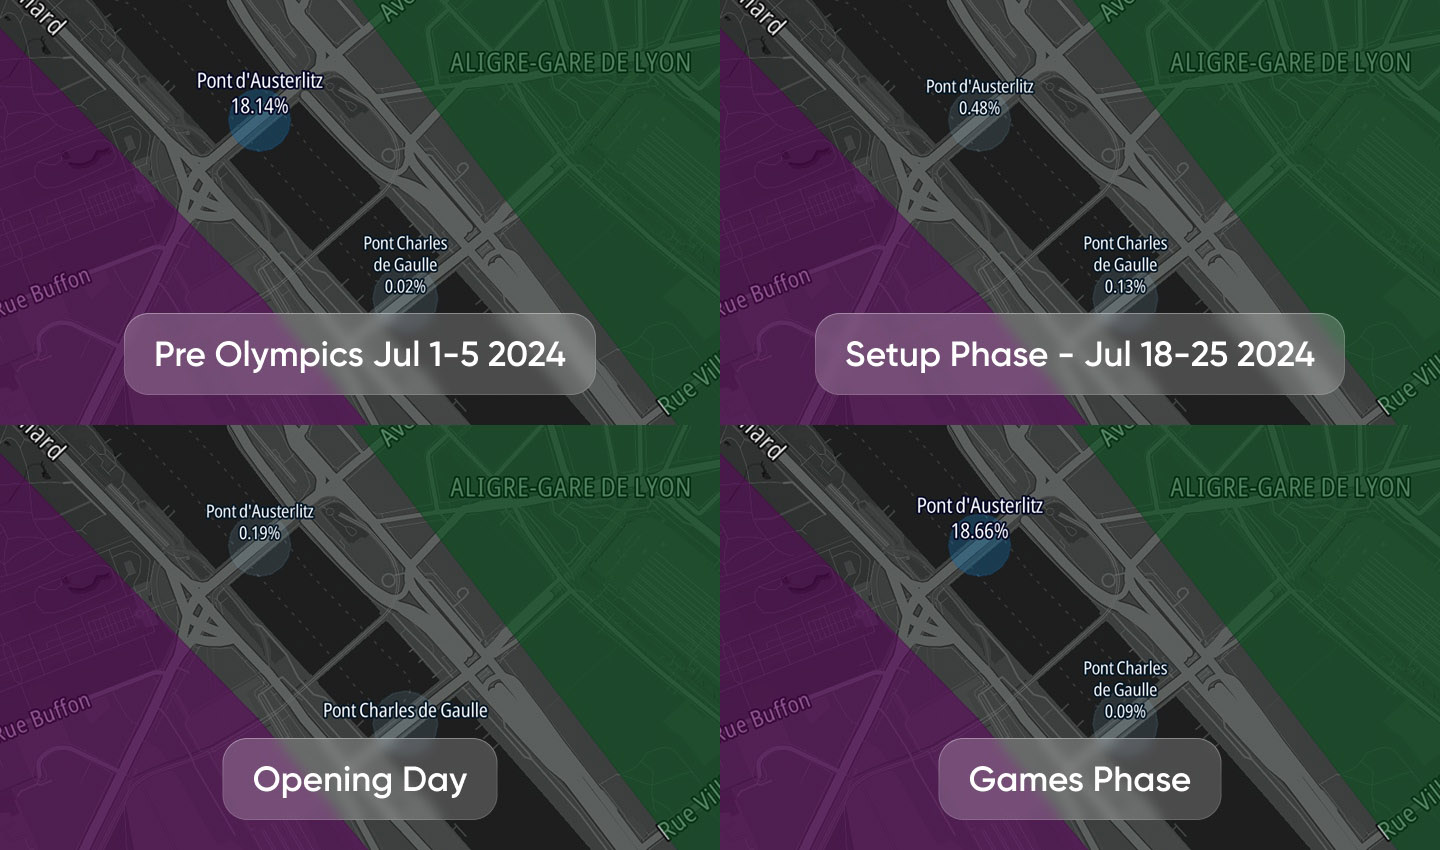 Paris Olympics road network comparison
TomTom Origin-Destination Analysis along the Seine River, indicating the percentage of traffic crossing each bridge, compared over key time periods to analyze how traffic flowed in response to road closures and event proceedings.
This type of analysis allows agencies to do more than simply report congestion. By quantifying how traffic shifted between bridges, banks and the ring road, they can evaluate whether their detour plans worked as intended, identify crossings that became new bottlenecks and refine future event plans. Combined with accurate digital closure data that is fed into navigation systems, traffic intelligence becomes a practical tool for managing known disruptions and improving the resilience of the network for the next large-scale event.
In January 2024, the Noto earthquake severely damaged infrastructure and cut power to monitoring systems. Road sensors were offline or unreachable. Emergency services urgently needed to know which routes remained passable.
Probe-based “passable-route maps” became a lifeline for Japan’s emergency operations. If a road segment showed vehicle movement in the past 24 hours, it could be identified as potentially viable, even if an official field inspection hadn’t occurred yet. Studies in Japan back this method up, showing vehicle probe data to be effective in identifying flood areas.
Real-time floating car data revealed functional roadways through a heavily damaged area, enabling emergency crews to dispatch more effectively and deliver aid faster in a time of critical need. This shows that when infrastructure is damaged, FCD offers a live sensor network to gain visibility and navigate the disaster.
Texas Hill Country floods: The impacts of extreme weather
In the US, natural disasters are increasingly impacting roadways, disrupting everyday commuting and long-haul freight. Predictions warn that climate-related damage to paved roads alone could cost up to $20 billion per year by 2030 as heat, heavy rain and coastal flooding accelerate deterioration and force more closures and rebuilds.
The 2025 Texas Hill Country floods provide a stark example. In early July 2025, catastrophic flash flooding tore through the area, overwhelming the Guadalupe River watershed and triggering one of the largest inland flood events in decades. Torrential rains submerged major freight arteries, including critical stretches of I-35 and I-45, rendering them impassable at peak flooding and severing key north–south logistics corridors.
Rural roads across surrounding counties were also washed out, isolating communities and complicating emergency response. Cars became stranded as detours pushed heavy trucks onto narrow rural routes, creating widespread bottlenecks. Compounding the chaos, more than 400 flight cancellations at Dallas–Fort Worth shifted additional pressure onto damaged ground transportation networks.
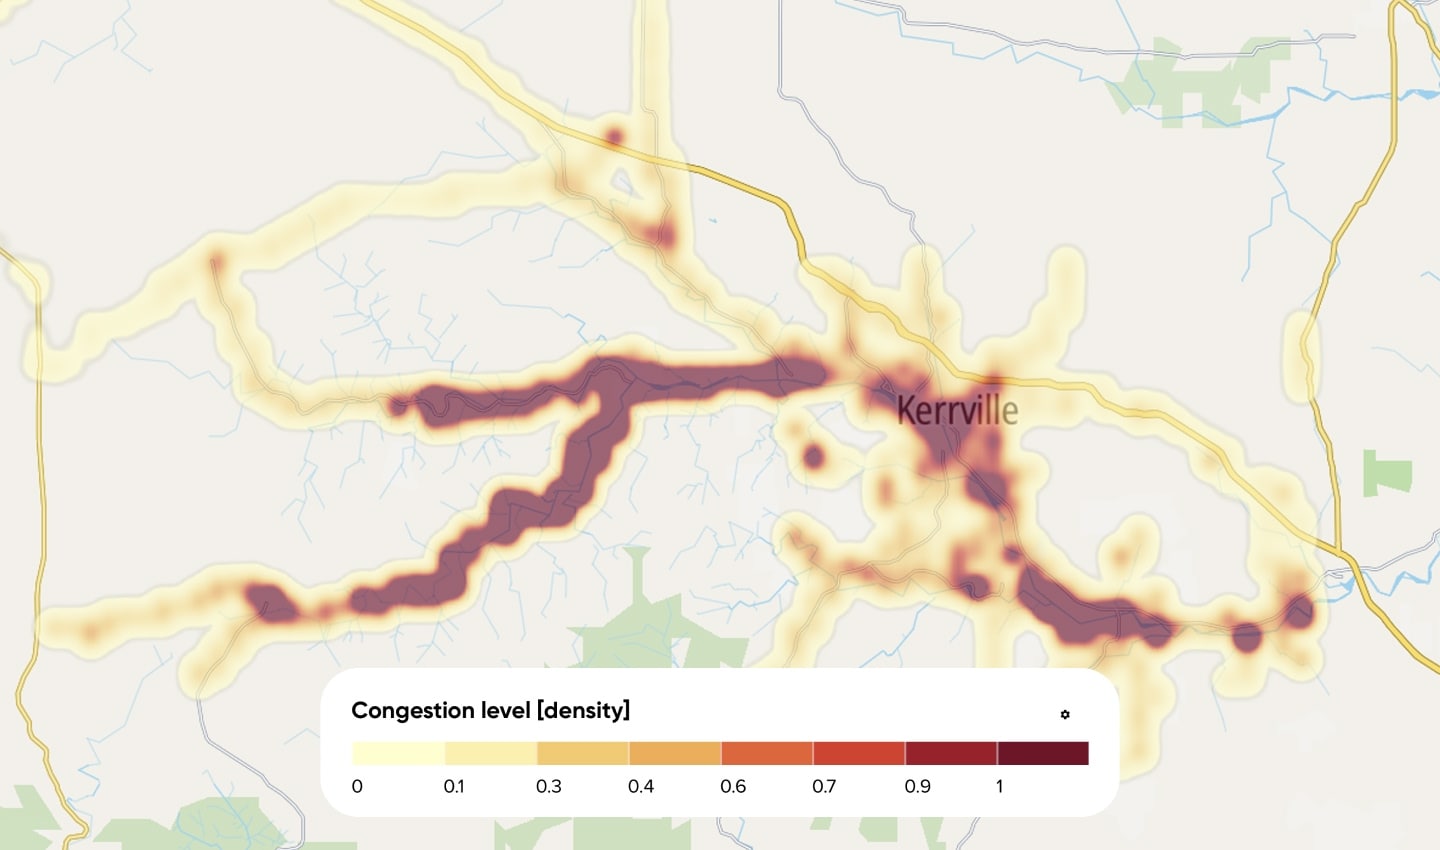 Texas Flood Heatmap Kerrville
The congestion level surged to 23% across all road classes, more than double from the previous month, with local roads hitting 51%. One week after the flood, congestion levels remained nearly as high as the day of the disaster (22% for all roads). Even two months later, average speeds across the county remained 7% lower than the previous year. This event indicates that natural disasters not only cause immediate slowdowns, but drive prolonged detours, reduced travel speeds and rising economic costs. It also underscores the growing urgency for resilient corridor design and adaptive routing strategies.
Why traffic data matters: A modern resilience toolkit
Across the examples, we see that resilient transportation operations blend infrastructure, analytics and communication. In most cases, this requires more insight than traditional tools can provide. Data-driven approaches fill the gaps, supporting effective functioning in a dynamic, disrupted ecosystem. To reiterate, some of the ways FCD and data tools can bolster resilience are through:
Traffic Stats for travel-time reliability, baseline building and after-action analysis
O/D Analysis for understanding disrupted travel patterns, diversion design and evacuation modeling
Junction Analytics for monitoring bottlenecks where signal timing can make or break diversion
Area Analytics and Route Monitoring for analyzing corridor, local- and regional-level performance during a disruption
Traffic Insights tool for authoritative digital closures that keep drivers away from danger
These data-based tools don’t replace cameras, detectors or other traditional systems, but complement them with a dynamic movement layer that enriches and covers far more of the network. Greater resilience is achievable when everything works together as one system.
Seeing clearly when it matters most
Road network resilience is no longer optional. Climate extremes, infrastructure failures and mass-gathering events are becoming larger and more common, while at the same time traffic is getting more congested and harder to predict. Cities, governments and transport agencies must not only manage uncertainty with clarity and precision, but also shift from reactive crisis to proactive, data-enabled resilience that helps prepare the network for potential disruptions.
Floating car data gives governments and cities the visibility they need to best anticipate, withstand and recover from disruption, used together with digital tools, operational playbooks and integrated control environments.
Resilience can’t eliminate disruption. But it can ensure that when it happens, authorities are prepared, ready to adapt and not operating in the dark. They can see how the network is behaving, understand where people need to go and guide them through uncertainty with greater safety and confidence.
People also read
)
Roads to efficiency: Data-driven transport planning in New York, Texas and California
)
The road to Vision Zero: How data can drive safer mobility
)
The global traffic challenge in numbers: What the TomTom Traffic Index data tells us
)
London is still the world's slowest city — highlights from the latest TomTom Traffic Index
* Required field. By submitting your contact details to TomTom, you agree that we can contact you about marketing offers, newsletters, or to invite you to webinars and events. We could further personalize the content that you receive via cookies. You can unsubscribe at any time by the link included in our emails. Review our privacy policy. You can also browse our newsletter archive here.