)
Transportation gives our cities life, enabling people and goods to flow through increasingly complex urban environments. But in the past decade, congestion has intensified across the United States. It’s getting harder to predict and more expensive to leave unchecked. At the same time, cities, governments and planners now have access to smarter, data-driven tools to manage today’s rising mobility challenges.
Population growth only accounts for part of the strain. Between 2010 and 2023, the US saw roughly 28M more people and 43M more car registrations — meaning vehicle registrations grew faster than the population in absolute terms. Traffic patterns have also become less stable, shaped by flexible work, shifting housing markets and rising ecommerce activity. At the same time, suburban expansion and increased freight demand are adding vehicle miles to roads, while we continue to see more frequent extreme weather events. All this is adding unprecedented stress on US transportation networks.
Road authorities and cities are working hard to manage network efficiency more effectively — in a way that not only improves mobility, but also safety, sustainability and reliability. Traditional planning tools, such as loop detectors, spot counts and static models, still play a role. But these tools struggle to capture how today’s travelers actually use road networks across cities, regions, states and countries.
The four dimensions shaping US mobility planning
Transportation planning in the US is a multi-layered process involving local, state, regional and federal cooperation. Despite varied governance structures, planning choices tend to fall along four strategic dimensions.Capacity expansion vs. network optimization
- New York has limited space, relying heavily on optimization.
- Texas prefers expansion to meet rapid growth.
- California blends approaches, pairing limited expansion with extensive optimization.
2. Modal shift vs. status quo (reinforcing existing travel pattern)
- New York emphasizes multimodal transport, relying heavily on transit.
- Texas is auto oriented, with growing yet modest transit investments.
- California makes major investments in rail and active transportation to encourage long-term behavioral change.
3. Demand management vs. unrestricted travel
Demand management uses tools like congestion pricing, dynamic tolling, parking reform and employer commute programs to reduce strain in high-demand areas. Unrestricted travel approaches allow users to choose when and where they drive, without any built-in restrictions to influence choices.- New York is the national leader in comprehensive demand management.
- Texas uses dynamic pricing to manage lanes.
- California is piloting pricing on specific corridors, with interest in broader application.
- New York and California have strong alignment with climate goals.
- Texas emphasizes mobility and economic performance.
State-level profiles
We’ll now look at how New York, Texas and California are addressing challenges in their cities and regions. Each state shares the same goal of uncovering unique traffic patterns, spotting trouble areas and implementing changes that reduce congestion and improve safety. Yet each state also reflects a distinct combination of structural forces, policy priorities and institutional capabilities that impact their decisions.New York: Constrained and transit rich
With one of the densest urban environments and limited space for new roadway construction, New York relies heavily on demand management and operational improvements. The state focuses on maximizing transit, protecting street space for high-efficiency modes and using data to identify targeted performance interventions. Key strategies include:- Congestion pricing for Manhattan
- Bus network redesign and bus-only lanes
- Freight and curb management initiatives
- Micromobility expansion
- Limited, targeted roadway reconfiguration
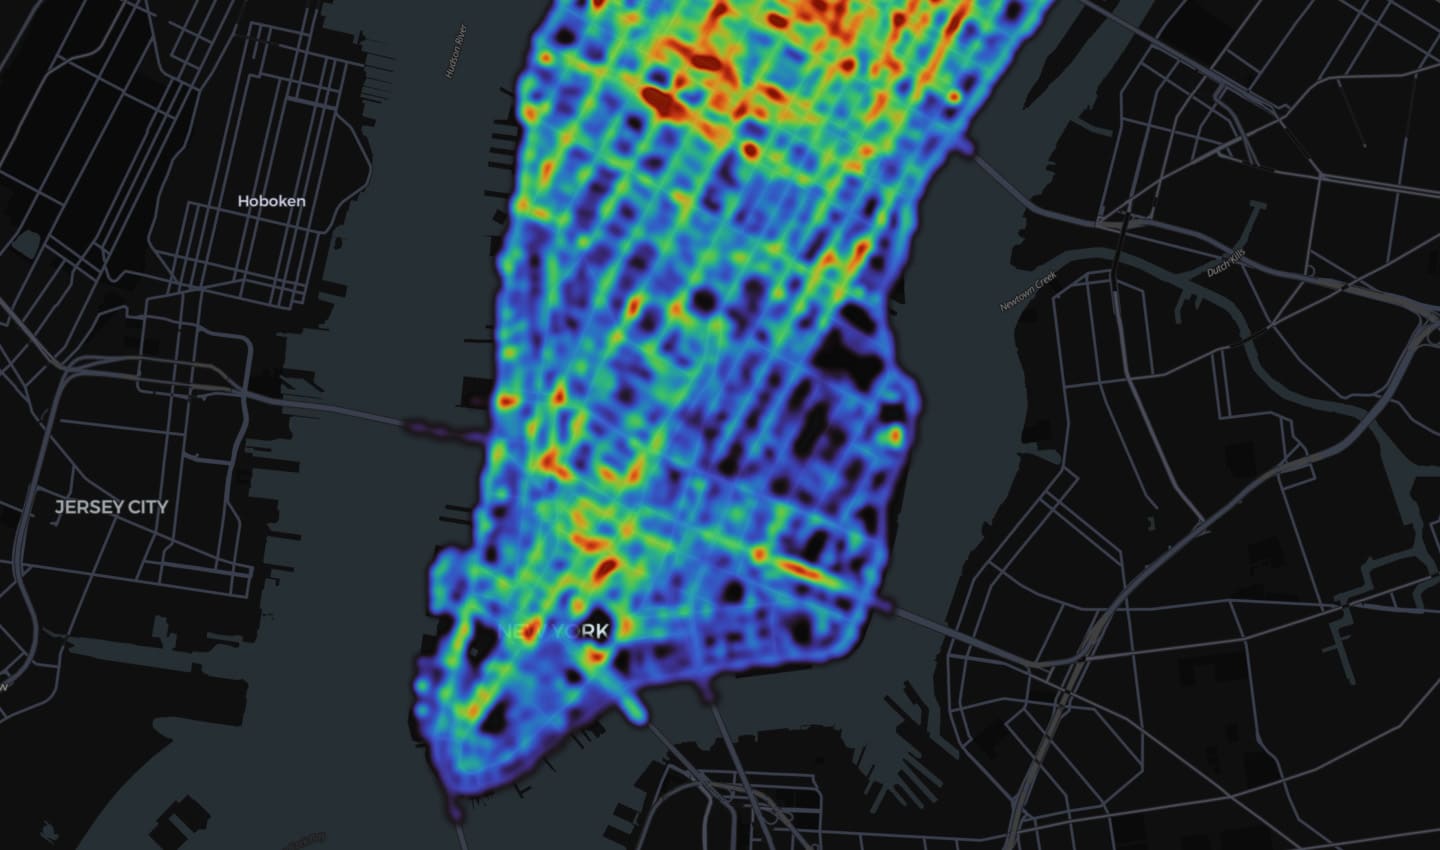 NYC Traffic Heatmap
Case study: Congestion pricing reduces delays in Manhattan
New York City launched the nation’s first congestion pricing program in January 2025. At the time, it was the slowest-moving city in the US, according to the TomTom Traffic Index and in need of real change.
Early results showed great improvements:
- Congestion dropped from 24.7% to 16.9% (Jan – mid-March 2025 vs. 2024)
- Average travel times improved by 3 minutes 5 seconds per 10 km
- Average speeds increased from 17.6 km/h to 19.4 km/h
- Bus speeds improved on several major corridors
- Traffic entering the priced zone declined, reducing bottlenecks
- Transit ridership increased on routes where reliability improved
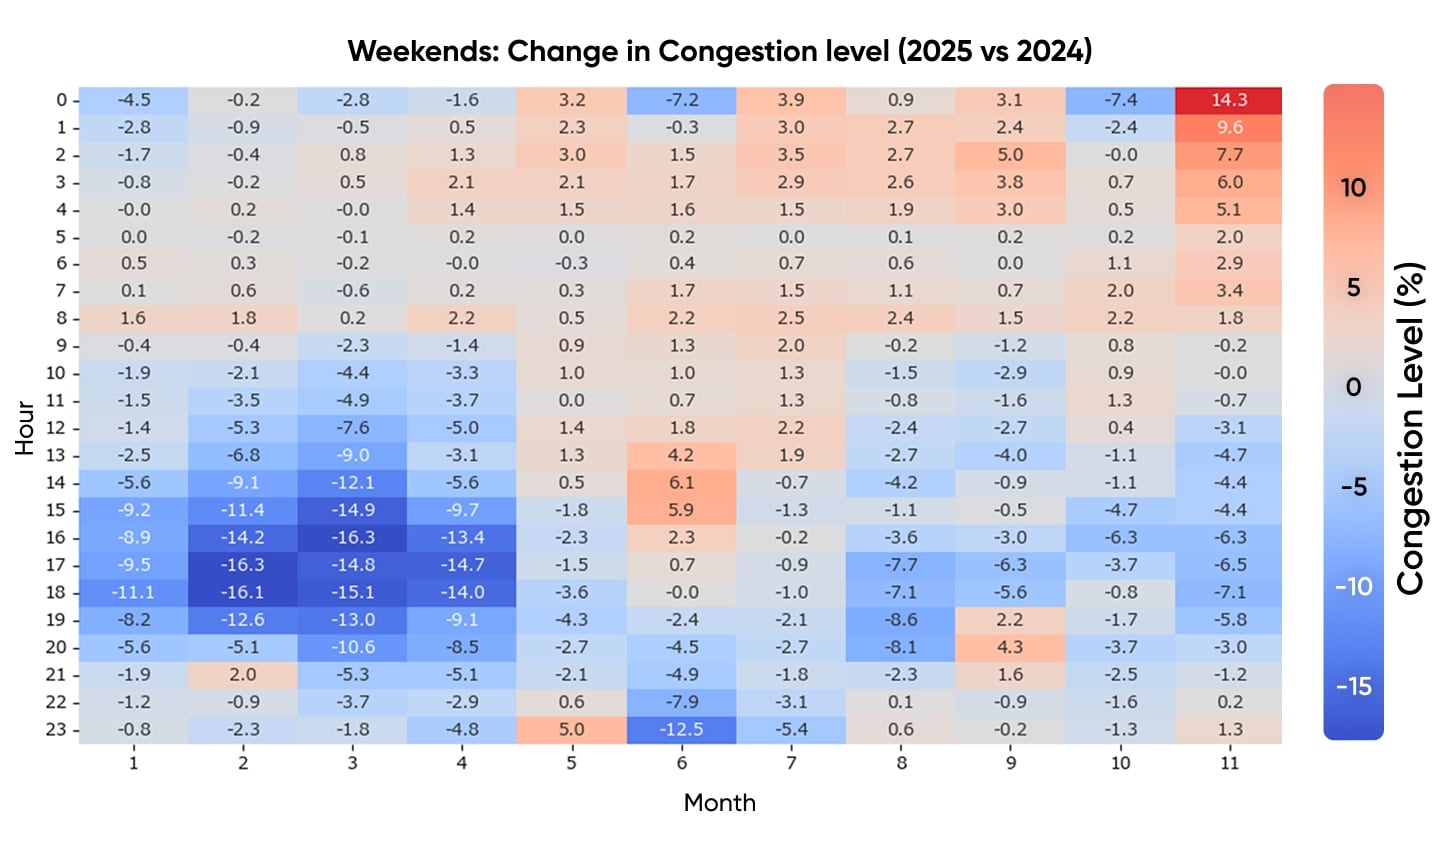 NYC weekends congestion data 2024 vs 2025
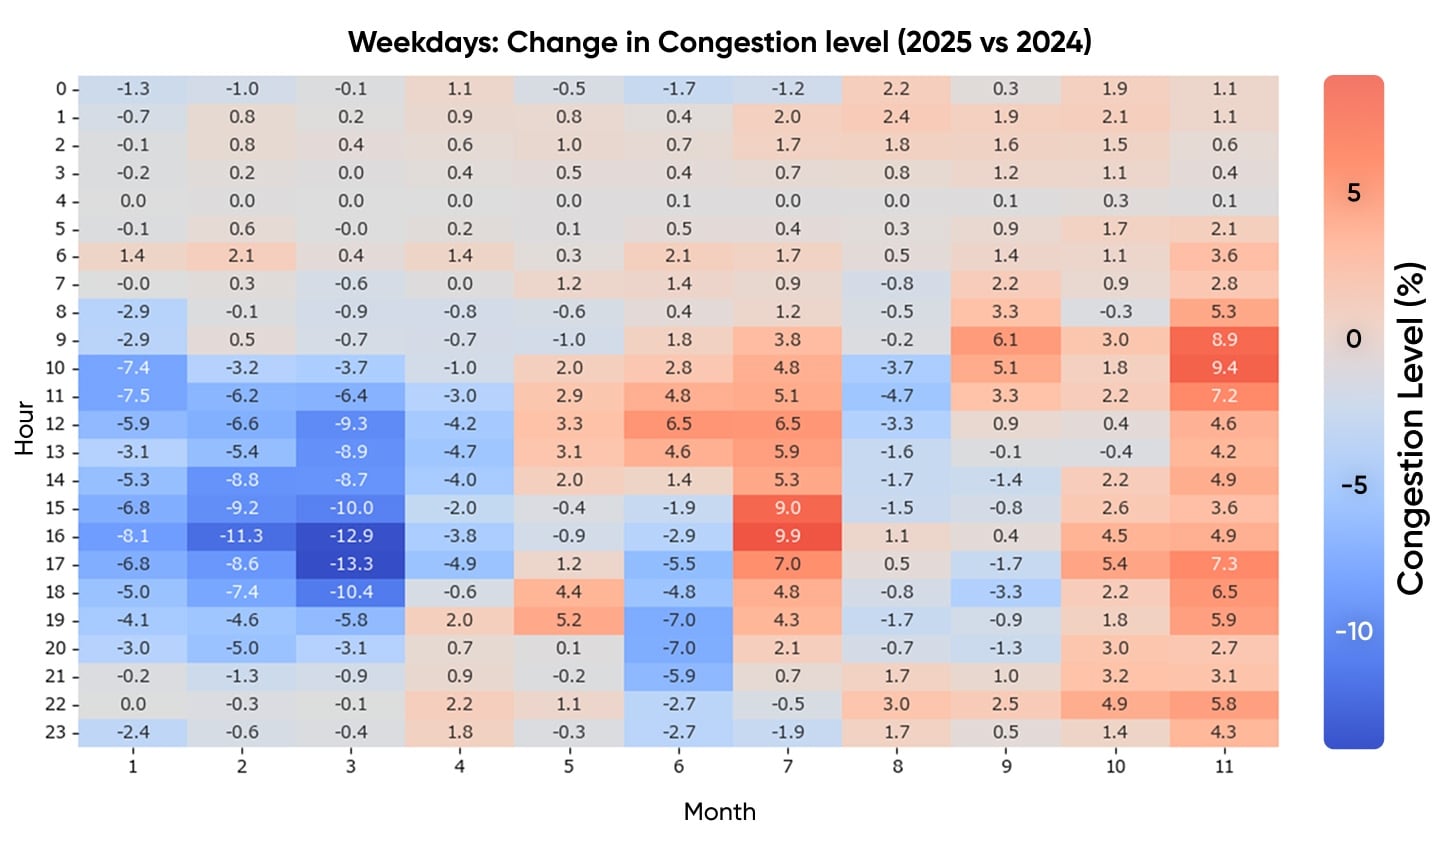 NYC weekdays congestion data 2024 vs 2025
TomTom Traffic data showing 2024 pre- and 2025 post-NYC congestion pricing congestion levels, indicating reduced levels (blue) in the early months with mainly higher levels (red) from May onwards
So, while the overall congestion average for 2025 was 1.1% lower than 2024 (excluding December 2025), initial gains have not sustained. Further monitoring is needed to explore what’s working and where continued improvement could make the difference.
Texas: High growth and auto-dependent expansion
Texas is home to some of the fastest-growing metropolitan areas in the US. Houston, Austin, San Antonio and Dallas–Fort Worth are expanding rapidly in both population and employment, with a lot of growth in auto-oriented, low-density corridors. Freight activity is also intensifying, driven by energy production, international trade and regional distribution. As a result, congestion has risen across all major metros and vehicle miles of travel (VMT) continues to grow year over year. The state has focused on roadway expansion to combat congestion, investing more than $80 billion in the Texas Clear Lanes project. This major state-led initiative focuses on using data to reduce congestion and delays, despite rapid population growth.
Key strategies include:- Major freeway widenings on corridors such as the I-10, I-35 and I-45
- Elevated connectors and interchange reconstruction
- Diverging diamond intersections (DDIs)
- Expansion of managed lanes in Houston and Dallas
- Construction of tolled facilities like SH 130
- Targeted ITS deployments and operational improvements
 Skyline Austin, Texas
District-level analysis for state-wide efficiency
While Texas Clear Lanes has improved conditions on key corridors, district-level efficiency data shows where congestion remains most severe. From 2023–2025, the lowest efficiency and poorest reliability are concentrated in the largest metros — led by Houston and Austin, followed by Dallas, Fort Worth and San Antonio. Smaller districts generally operate near free-flow with more stable day-to-day performance.
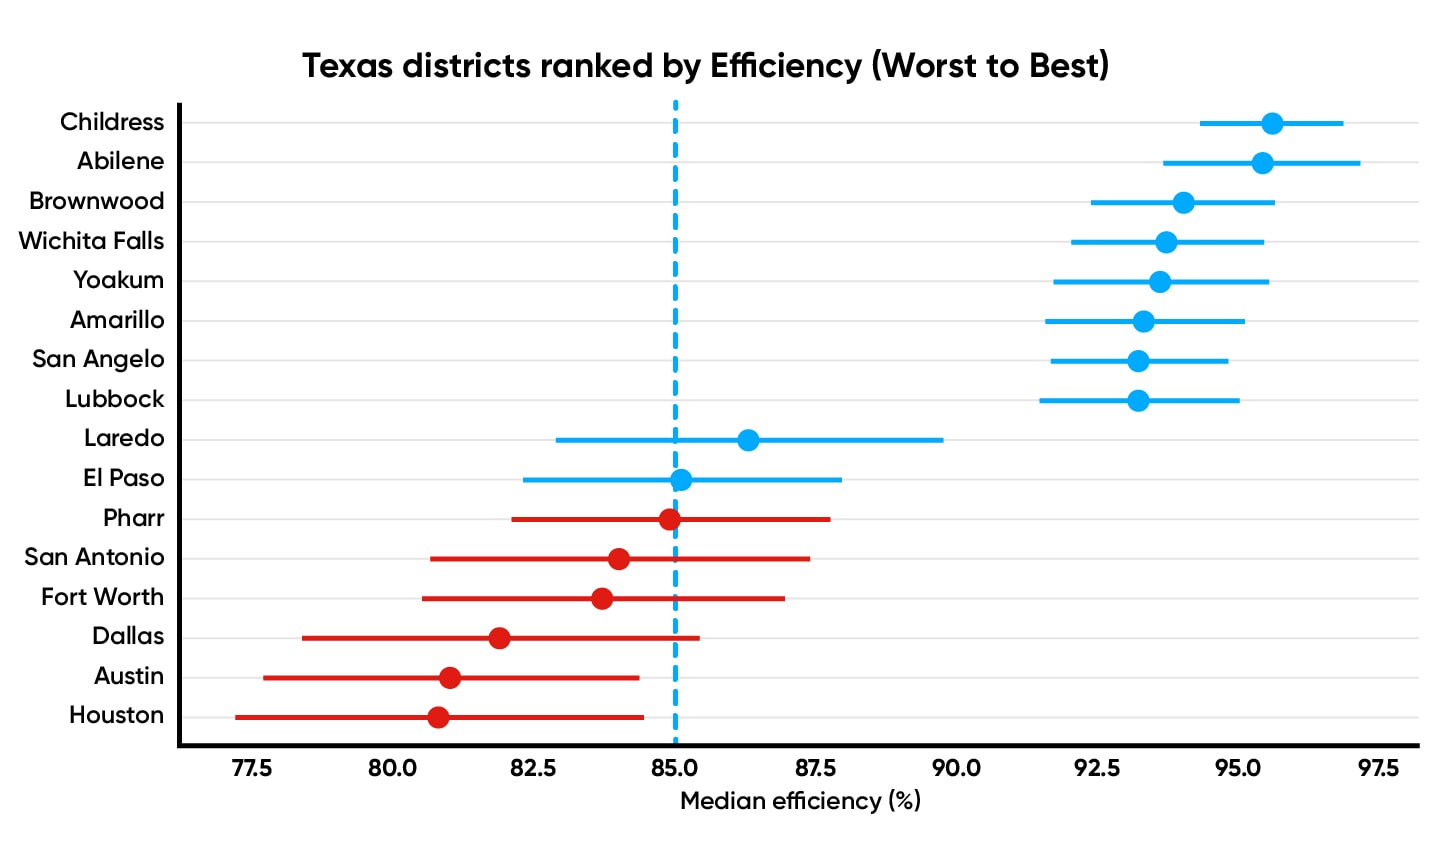 Texas district-level congestion analysis for worst to best performance
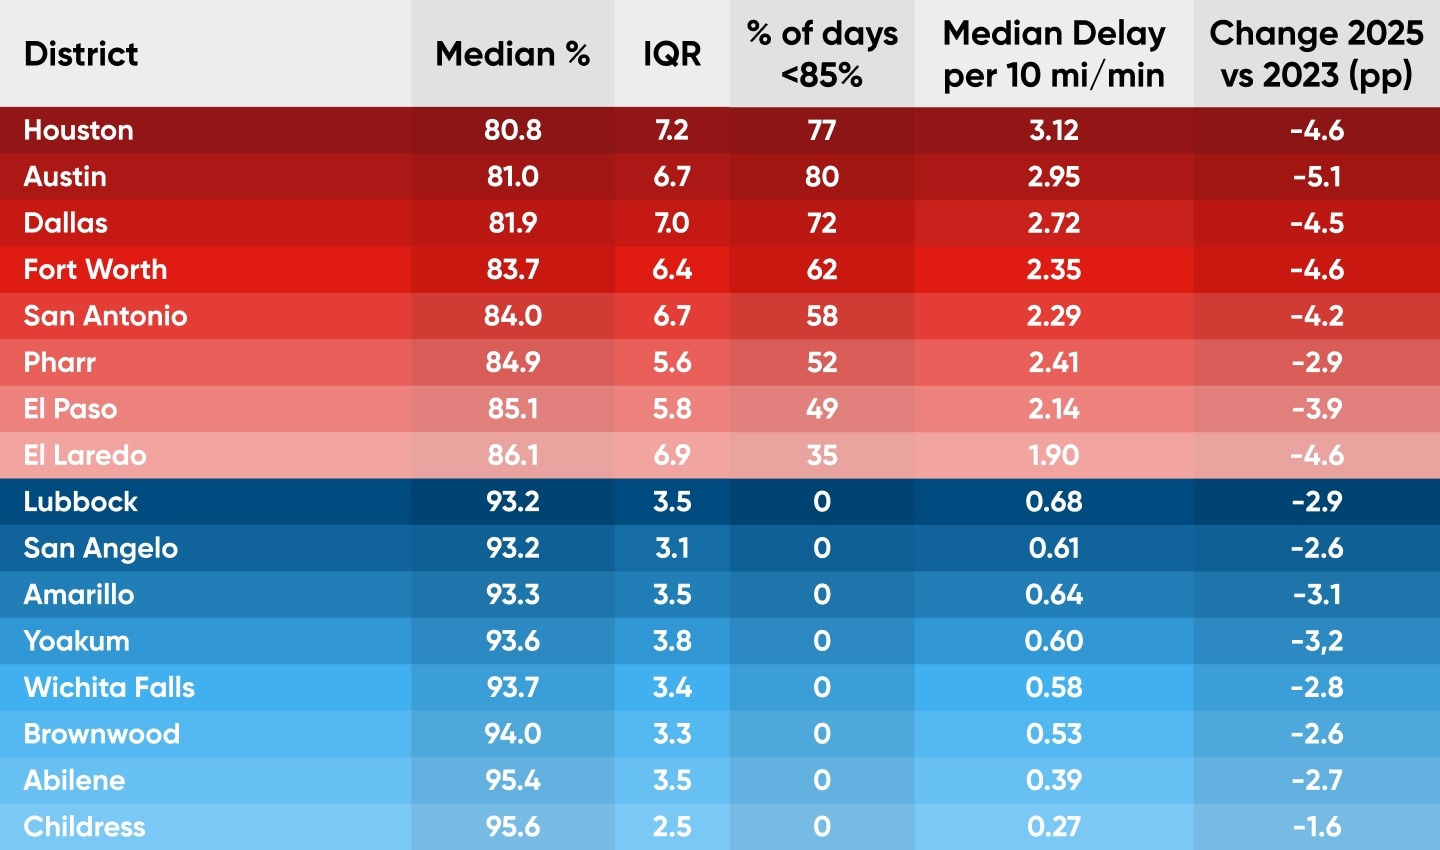 All Texas Districts data chart 2025 vs 2023Network trends show why a broader view matters. Project-level gains can be offset by demand growth, construction and shifting travel patterns, keeping district performance under pressure. Comparing typical efficiency with variability helps guide strategy: volatile districts need a mix of capital and operational responses, while consistently congested areas benefit most from targeted bottleneck relief and managed corridors.
California: Climate policy, multimodal investment and resilience planning
California faces persistent congestion across all major urban regions, approaching its mobility challenges through a climate-aligned, multimodal lens. Legislative mandates drive VMT reduction, emissions cuts and investment in alternatives to driving.The California Transportation Plan 2040 reflects these priorities, laying out a long-range statewide plan to create a sustainable, socially equitable, integrated multimodal system.
Major investments include:- LA Metro rail extensions (D Line, A Line, Regional Connector)
- Bus rapid transit and extensive bus priority corridors
- Statewide funding for active transportation and complete streets
- Express lane networks paired with selective capacity expansion
Resilience planning for evacuation routes and wildfire response
 Growing City and Infrastructure planning
District-level analysis for state-wide efficiency
From 2023–2025, the largest metros show the most persistent congestion. Los Angeles/Ventura performs worst, with congestion on nearly every day, followed by Orange County, the Bay Area/Oakland and San Diego. These are also the regions where the biggest investments are underway, because the potential time savings for travelers are greatest.
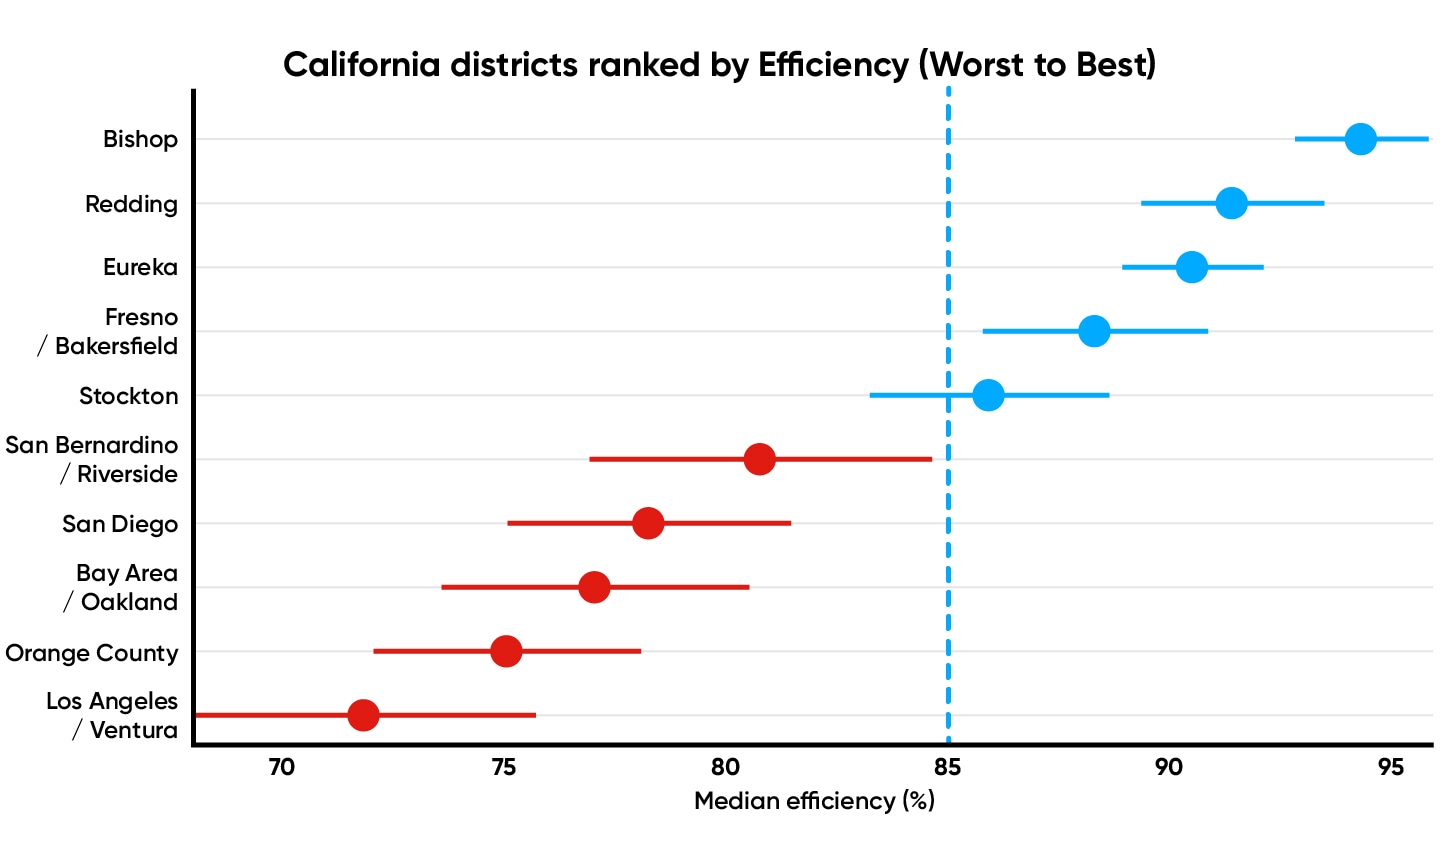 California Districts Ranking - worst to best
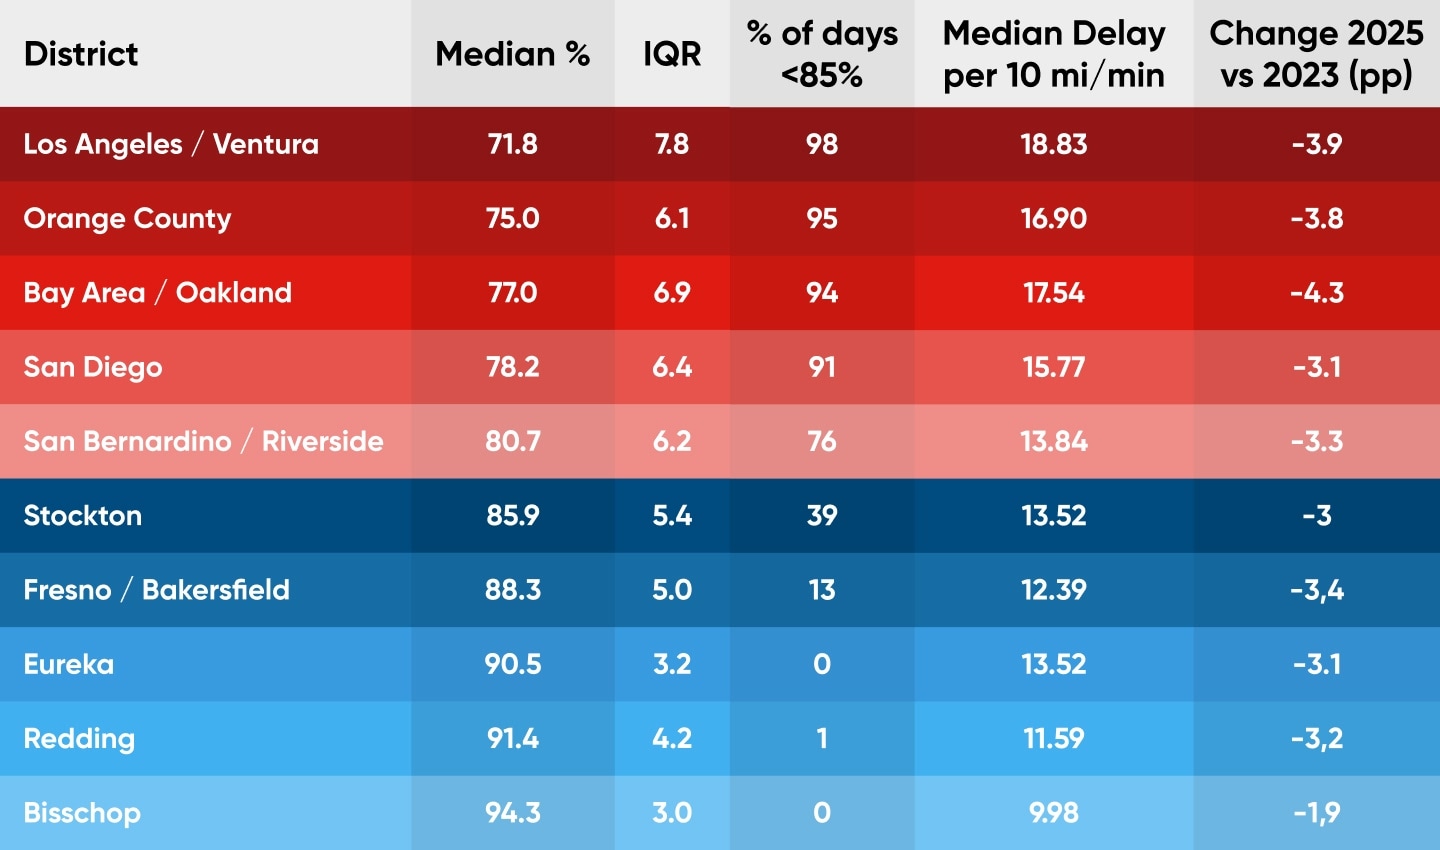 California Districts - 2025 vs 2023Network trends reveal a key takeaway: efficiency declined statewide over this period, even in better-performing districts. This highlights why network-level monitoring matters — project gains can be offset by growth, construction and disruptions — making these metrics most useful for identifying where deeper corridor analysis is needed next.
Data drives smarter planning and performance
From Manhattan’s dense grid to Texas’s sprawling freeway networks to California’s climate-critical corridors, every state faces its own blend of constraints, growth pressures, and priorities. But they share a common challenge: understanding how travelers actually use networks in real time, and how those behaviors evolve after major projects or policy changes. Data that’s rich, accurate and accessible is helping planners:- Evaluate the impact of new policies and infrastructure
- Identify emerging hot spots before they become chronic issues
- Improve safety by locating speed volatility and sudden slowdowns
- Model alternative scenarios with greater confidence
- Support climate, equity and economic goals with measurable evidence
People also read
)
The global traffic challenge in numbers: What the TomTom Traffic Index data tells us
)
Building road network resilience: How to keep moving through disruption
)
The road to Vision Zero: How data can drive safer mobility
)
What the shutdown and holiday periods revealed about US airport traffic in 2025
* Required field. By submitting your contact details to TomTom, you agree that we can contact you about marketing offers, newsletters, or to invite you to webinars and events. We could further personalize the content that you receive via cookies. You can unsubscribe at any time by the link included in our emails. Review our privacy policy. You can also browse our newsletter archive here.