)
We’ve all probably been stuck at traffic lights that seem to take forever to change. Improperly timed traffic signals aren’t just frustrating for drivers, they can also worsen congestion, pollution and road safety. Let’s explore how TomTom Junction Analytics helps optimize timing at intersections to keep traffic moving smoothly and safely.
All drivers have to stop at traffic lights sometimes – and as they wait for red lights to turn green, traffic build-up can become significant. According to research from the University of Maryland, close to 20% of all congestion in the U.S. is caused by waiting at traffic signals. That amounts to around 329 million vehicle hours of delay every year.
Reducing the amount of time spent waiting in traffic is just one of many reasons why it’s important to make sure that traffic lights are optimally timed. At intersections with out-of-sync traffic lights, vehicles stop and start erratically, contributing to increased vehicle emissions and air pollution, higher fuel consumption and decreased road safety.
Built to help traffic and road authorities spot and minimize delays across signalized intersections (intersections with traffic light systems), TomTom Junction Analytics plays a vital role in boosting road safety, reducing emissions and cutting congestion. Let’s take a closer look at how this solution works to optimize traffic light performance and traffic flow.
A smarter way to monitor intersections
Traditionally, if you wanted to measure and optimize traffic light systems at intersections, you needed specialized sensors and hardware. These systems tend to be expensive to install, operate and maintain, meaning it’s not always feasible for road and traffic authorities to use them. They also only provide insight for that one junction. If you want to analyze multiple signalized intersections, you’ll need to invest in a significant amount of infrastructure. And not only does that increase costs, but it also takes time to install and maintain.
Rather than relying on sensors, Junction Analytics uses floating car data (FCD), gathered from TomTom’s network of more than half a billion connected devices, including vehicles and smartphones. As these devices move along real roads in real time, they deliver their timestamped location to Junction Analytics. This allows the solution to provide a near-real-time view of vehicle movements and traffic light performance at signalized intersections — without the need for costly, complicated hardware — and it can do it at any intersection where there are vehicles.
Understanding and optimizing traffic movements
By tapping into the data that Junction Analytics delivers, traffic and road authorities can better understand how vehicles move through intersections and take targeted action to improve traffic flow. For instance, a municipality monitoring intersections with Junction Analytics might notice that long traffic lines tend to build up at one approach to an intersection at a certain time of day. It could assign more green time for the traffic lights on that particular approach to smooth out the flow of traffic and help vehicles clear the intersection faster.
Think about rush hours, where there’s more traffic entering a city in the morning and leaving it in the evening. Signals can be optimized to prioritize the heaviest flow of traffic, keeping it moving.
Kristina Vuletic, Senior Product Manager for TomTom Traffic, comments: “Junction Analytics is useful for any organization that wants to improve traffic flow around their facilities. We work with many ports and airports, for example. They have a lot of vehicle traffic entering and leaving their facilities, and they need to ensure it moves smoothly so that people and goods can get around with minimal disruption. With Junction Analytics, these organizations can keep an eye on key intersections surrounding a port, detect bottlenecks in real time and reconfigure signal timing to keep traffic flowing optimally.”
Smoothing traffic flows at intersections also plays a role in cutting down on vehicle emissions and improving safety. Well-timed traffic lights reduce the need for vehicles to stop, start and rev their engines — driving behavior that contributes to higher levels of emissions and pollution. Similarly, when vehicles can move smoothly through intersections, without having to constantly slow down too much or wait for long periods, it reduces the risk of drivers getting frustrated and distracted, which can lead to more accidents.
Junction Analytics in action
Customers looking to make use of Junction Analytics can choose from two delivery options: API and a companion web app, accessible via the TomTom MOVE Portal. In the web app, users can configure and visualize intersection locations and use intuitive analytics tools and reporting to obtain detailed insights into signal performance and mobility patterns at those locations.
Kamil Nowacki, Senior Quality Specialist, TomTom Traffic Analytics, explains how customers typically work with Junction Analytics: "Users are presented with an interactive view, where they can visually define and view intersections on a map. All they have to do is find the intersection they're interested in and draw a circle around it, then Junction Analytics starts its analysis.”
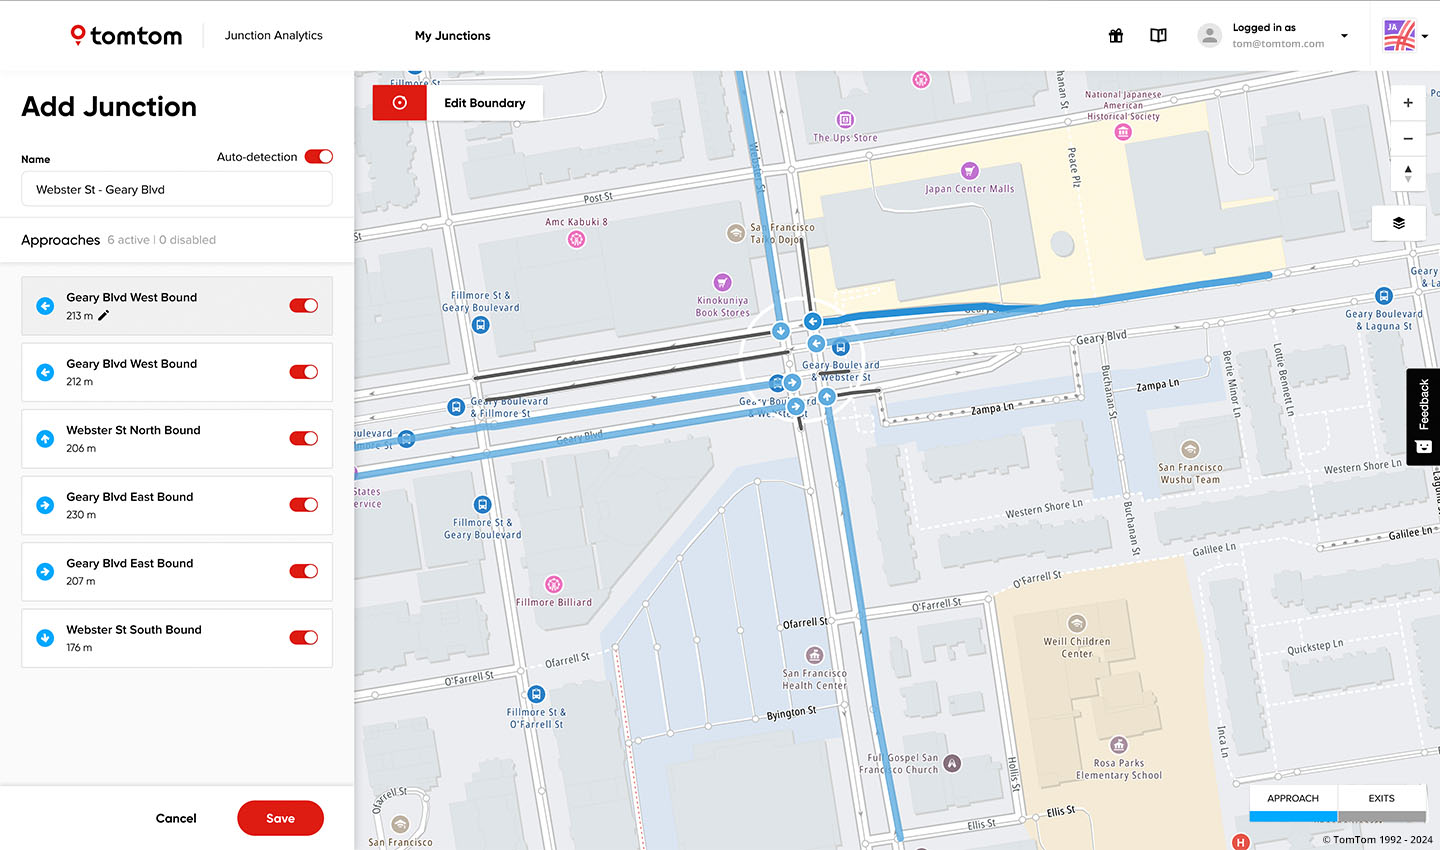 Defining and analyzing an intersection in Junction Analytics.
After they have created an intersection, users can select any of its four approaches and view the following information:
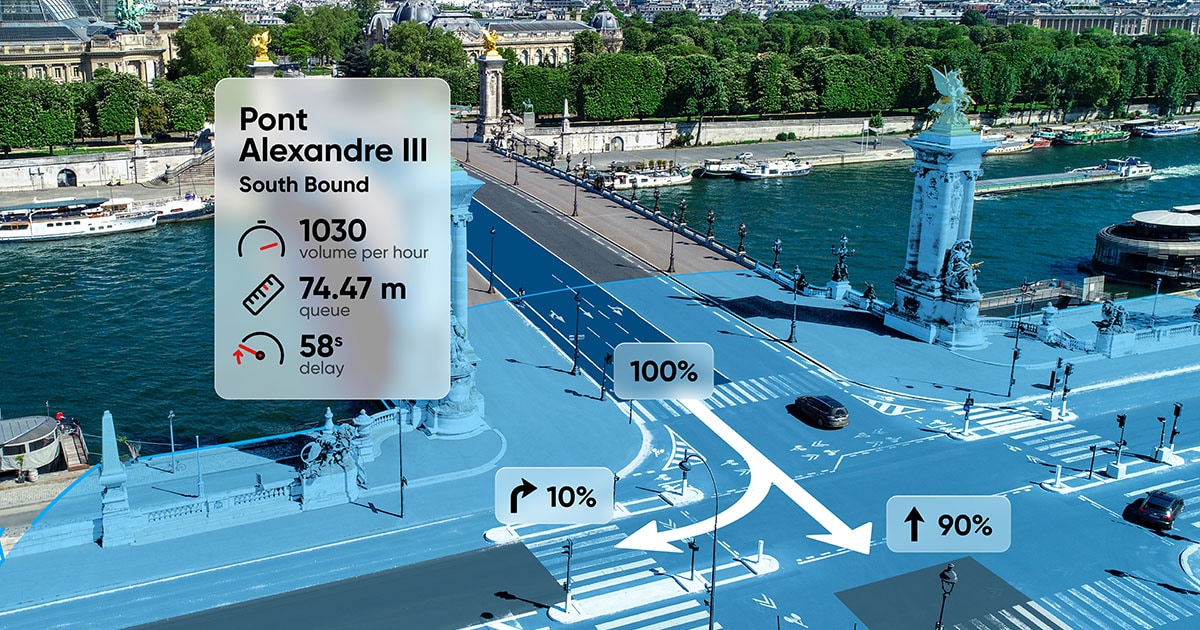
Turn ratios: the percentage of vehicles making a turn in a specific direction (left, right or straight) while leaving the junction approach.
Delay: the current delay (in seconds) for the whole approach length.
Usual delay: how long (in seconds) it usually takes for drivers to leave the junction after stopping.
Queue: the length (in meters) of the current line of vehicles waiting on the approach.
Stops: the average number of stops per vehicle on the approach (calculated from all vehicle probes in the last 30 minutes).
Travel time: how long (in seconds) it currently takes for the vehicles to travel through the approach line.
Free flow travel time: how long (in seconds) it takes for the vehicles to travel through the approach line during free-flow conditions (i.e. when there is no traffic, like in the middle of the night).
Volume per hour: an estimate of how many vehicles travel through the approach per hour. (This is an experimental feature, and the accuracy of results can vary.)
Not only does Junction Analytics return real-time information on intersection performance, once a user creates and saves an intersection, the solution will automatically collect and store data on that intersection over time.
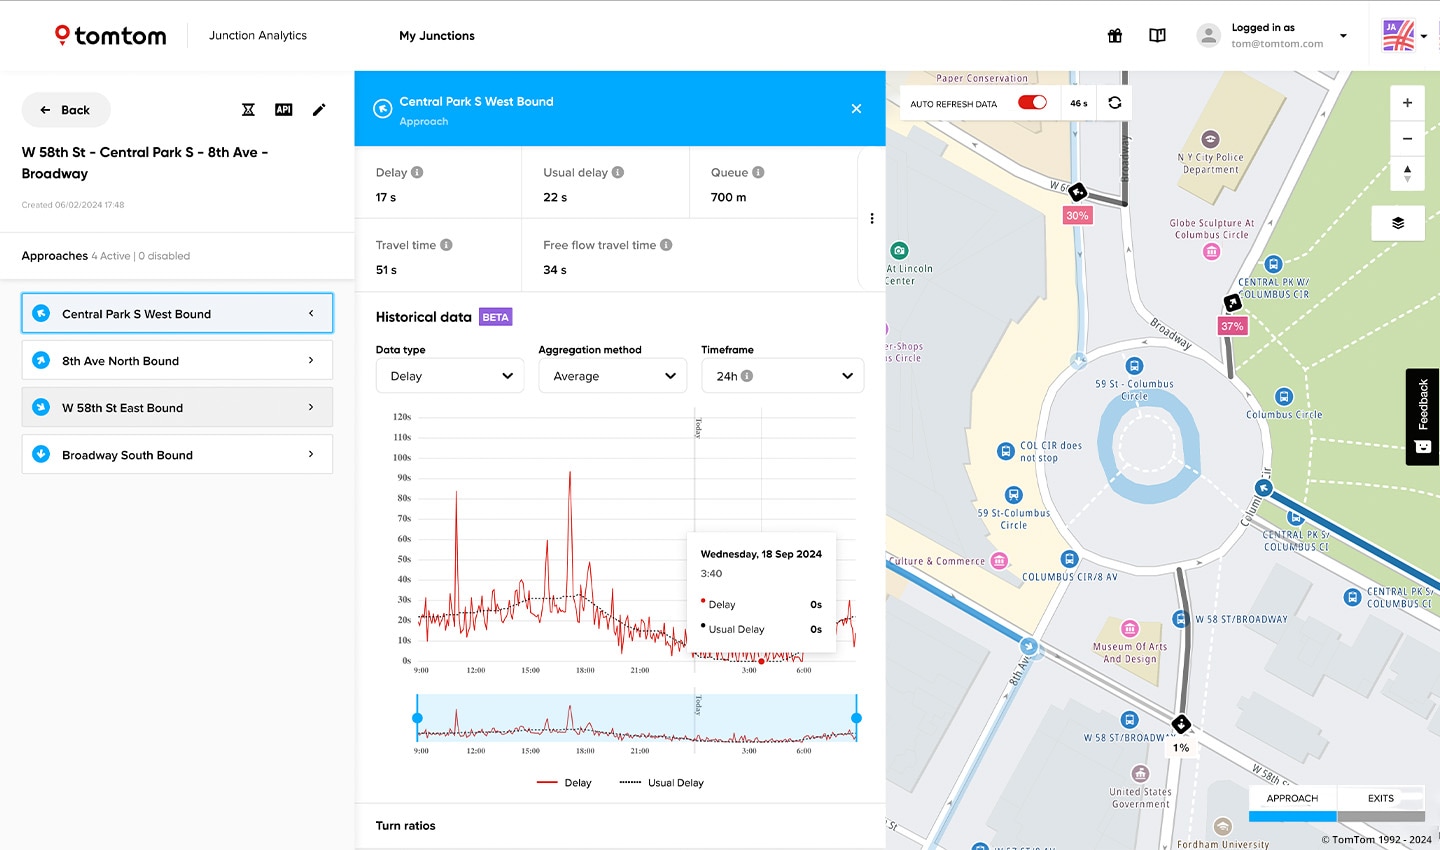 Junction Analytics collects data on traffic movements at pre-defined intersections over time, allowing users to analyze past performance and predict future trends.
Kamil Nowacki adds: “The tool essentially builds an archive of data for every intersection saved by a user. This is really useful for running comparisons and historical analyses, allowing users to track trends and see how traffic changes over time. For instance, looking at historical data for an intersection could show that certain approaches tend to get busier at specific times or on specific days of the week. With that insight, traffic managers could proactively adjust traffic light timings to reduce congestion during busy periods.”
With this wealth of real-time and historical data, customers can get to the heart of how traffic moves around intersections. Junction Analytics offers a simple, cost-effective way to understand and take control of traffic, helping people move more efficiently and making cities cleaner and safer.
People also read
)
Inside TomTom's Traffic products: TomTom Traffic Flow
)
Inside TomTom's Traffic products: Traffic Stats
)
Inside TomTom's traffic products: Traffic Incidents
)
How TomTom and its partners help road authorities solve traffic challenges
* Required field. By submitting your contact details to TomTom, you agree that we can contact you about marketing offers, newsletters, or to invite you to webinars and events. We could further personalize the content that you receive via cookies. You can unsubscribe at any time by the link included in our emails. Review our privacy policy. You can also browse our newsletter archive here.