)
It’s known as the city that never sleeps — and many New Yorkers will not be surprised to learn that their city takes the prize for slowest moving in North America in 2024.
TomTom Traffic Index data paints a picture
It’s known as the city that never sleeps — and many New Yorkers will not be surprised to learn that their city takes the prize for slowest moving in North America in 2024.
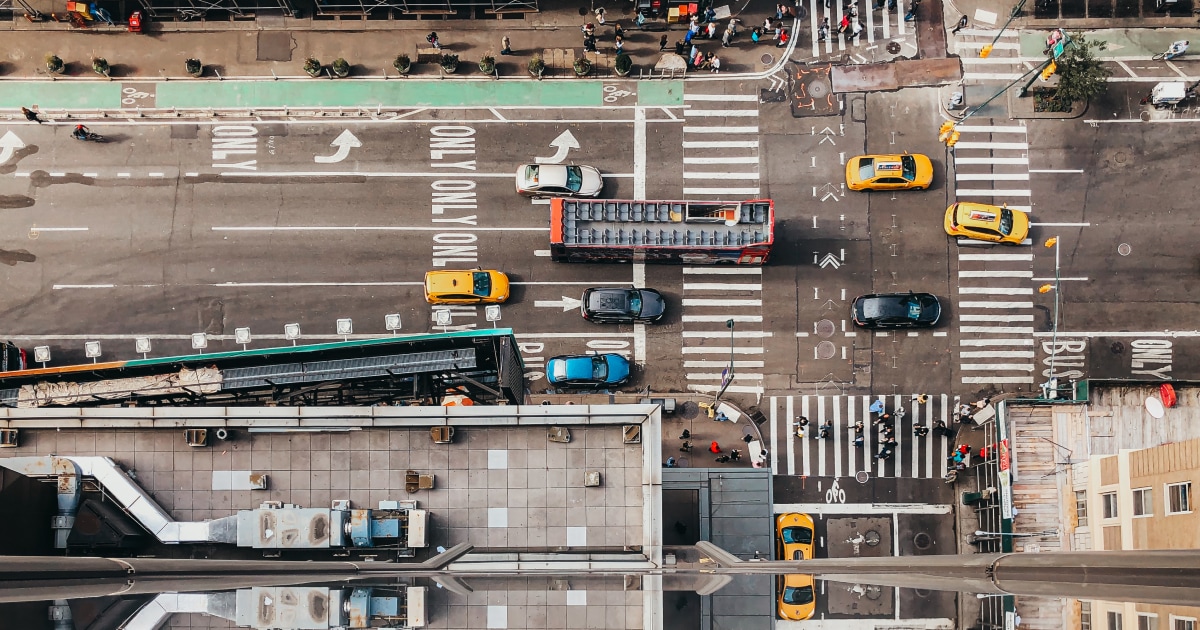
In TomTom’s Traffic Index, which looks at traffic in 500 cities in 62 countries and takes in 737 billion trips, data shows traffic congestion was worse in NYC than any other U.S. city in 2024. It takes an average of 31 minutes to travel just 10 km. That compares to just 24 minutes when traffic is free flowing.
It may be small comfort, but this still does not make New York the worst in the world. It’s ranked 25th, behind London, Dublin and Mexico City, with Barranquilla in Colombia taking the top spot for traffic congestion. However, there has been an average increase of 40 seconds per journey when compared with last year, so the Big Apple gridlock problem is not, yet, getting any better.
But with recent congestion zone tolls being introduced in the South part of Manhattan, that could change.
Feeling the rush
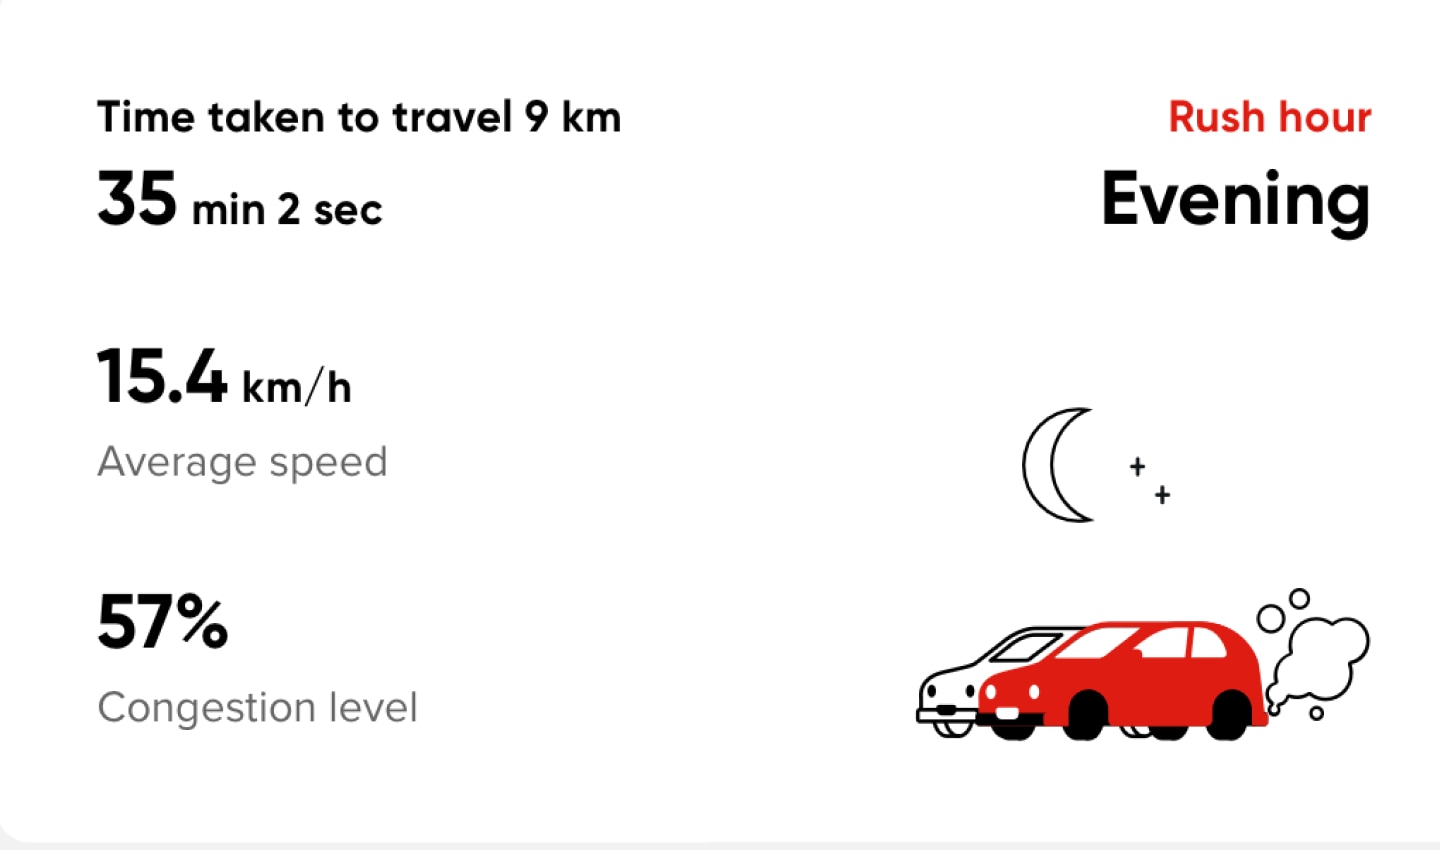
Rush hour, as you might expect, is the worst time to travel in New York City. During the morning rush hour, a journey that would take 24 minutes in traffic-free streets can take a little over 35 and a half minutes. In the evening rush hour, a 10 km trip can take up to 39 minutes.
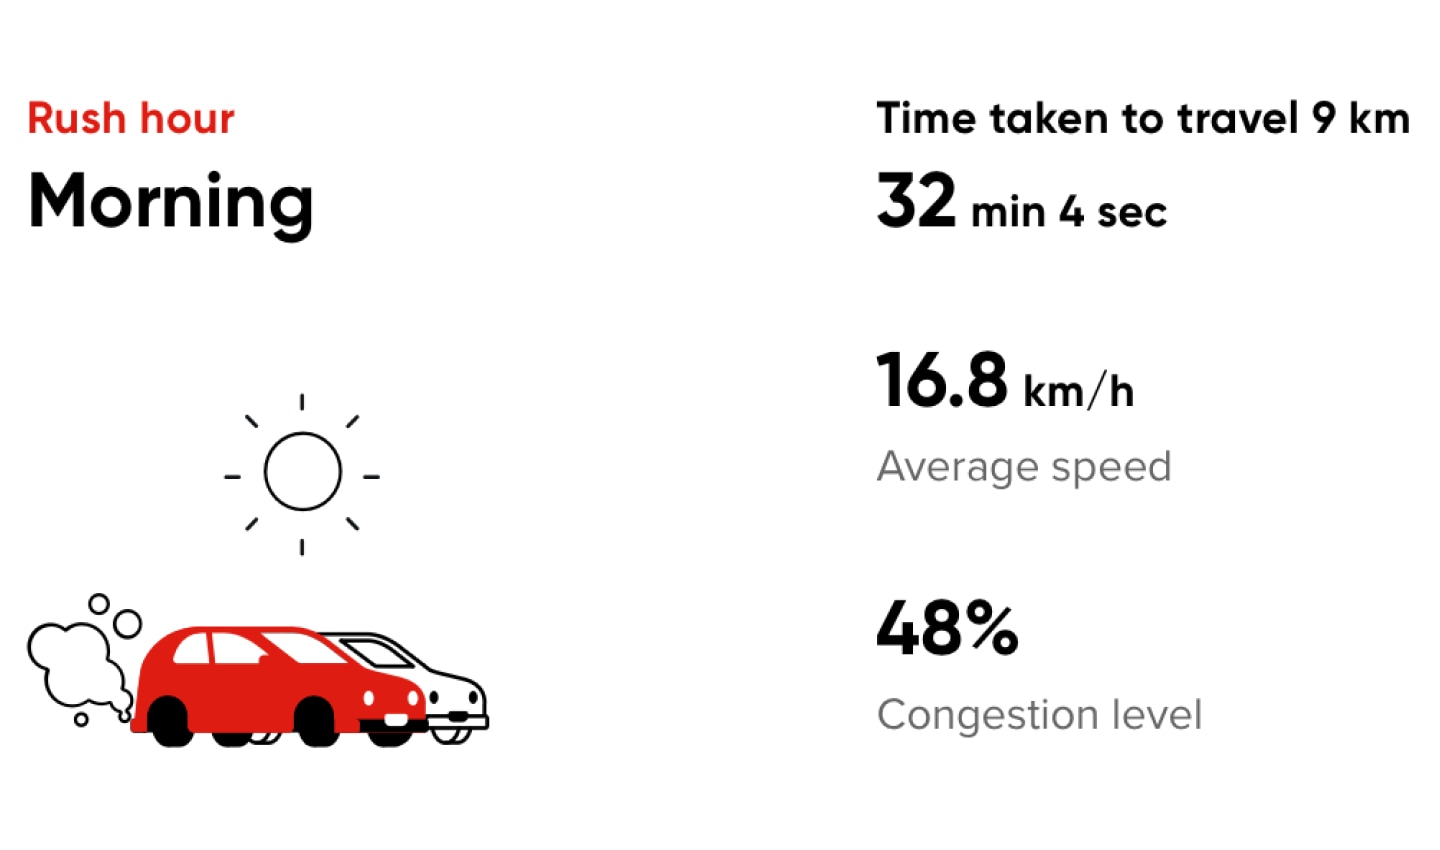
A typical New York driver will lose about 25 minutes of their day to rush hour traffic. TomTom’s Traffic Index shows that this adds up to an average of 98 hours per year in time lost to congestion.
The metropolitan area of New York-Newark-New Jersey has the highest GDP of any city in the States and is also the most densely populated. That all adds up to a high number of commuters, delivery drivers, school goers, pedestrians, cyclists, shoppers and ride sharers all sharing the same gridlocked roads during peak times.
The city’s grid layout has also been blamed for congestion. While easy to navigate for motorists and pedestrians alike, it means there are more than 1,000 intersections and this can slow traffic and disrupt flow, especially during rush hour.
Proliferation and growth of new mobility modalities and additional vehicles in the city center have also contributed to congestion in New York. One 2024 figure put the number at 90,000 taxis licensed in the city, along with an increase in new vehicle types added to the mix including e-bikes, cargo bikes and various delivery vehicles. One driver told the New York Times in 2024 it takes him 20 or 30 minutes to get from Port Authority to the Museum of Modern Art, which is a trip of just 1.3 miles (2 km).
More bus lanes and bike lanes in recent years have been added to New York’s streets to boost alternative methods of transport. The idea is to reduce congestion and carbon emissions at the same time. But some other road users have reported that reducing the space for cars has made congestion even worse, and bus lanes make it hard for taxi drivers to drop off passengers safely and without being fined.
Ralf-Peter, TomTom’s VP of Product Management for Traffic, says that modal split is the best way to alleviate congestion in cities, but its adoption and effective use won’t happen overnight.
Tackling the traffic
Over the years, there have been many attempts to reimagine the layout of New York, and measures to reduce congestion have been controversial. However, despite two thirds of New Yorkers saying they were against it in a survey last year, and even filed lawsuits against it, a congestion charge has been implemented at the start of 2025. It’s the first of its kind in the U.S.A., and other cities that also rank highly for congestion – Washington DC and San Francisco, for example – will no doubt be taking note.
New York City’s transportation authority says the toll is necessary to tackle gridlock, but also to raise funds for investment into the city’s wider public transportation network. Drivers are being charged a base toll of $9 to enter the busiest part of Manhattan, even on weekends, though rates vary according to vehicle type and time of day and there are discounts and exemptions.
(New York’s Metropolitan Transport Authority has a handy calculator to estimate your toll price.)
The tolled area has been dubbed the “congestion relief zone.” It includes famous landmarks including the Empire State Building, Times Square and the financial district around Wall Street and covers an area just south of Central Park. And less than a month in, it seems to be working, but it’s unclear if things will stay that way.
Check out this tweet from X (formerly Twitter) user @typesfaster (David Petersen), that shows how quiet typically busy streets have become.
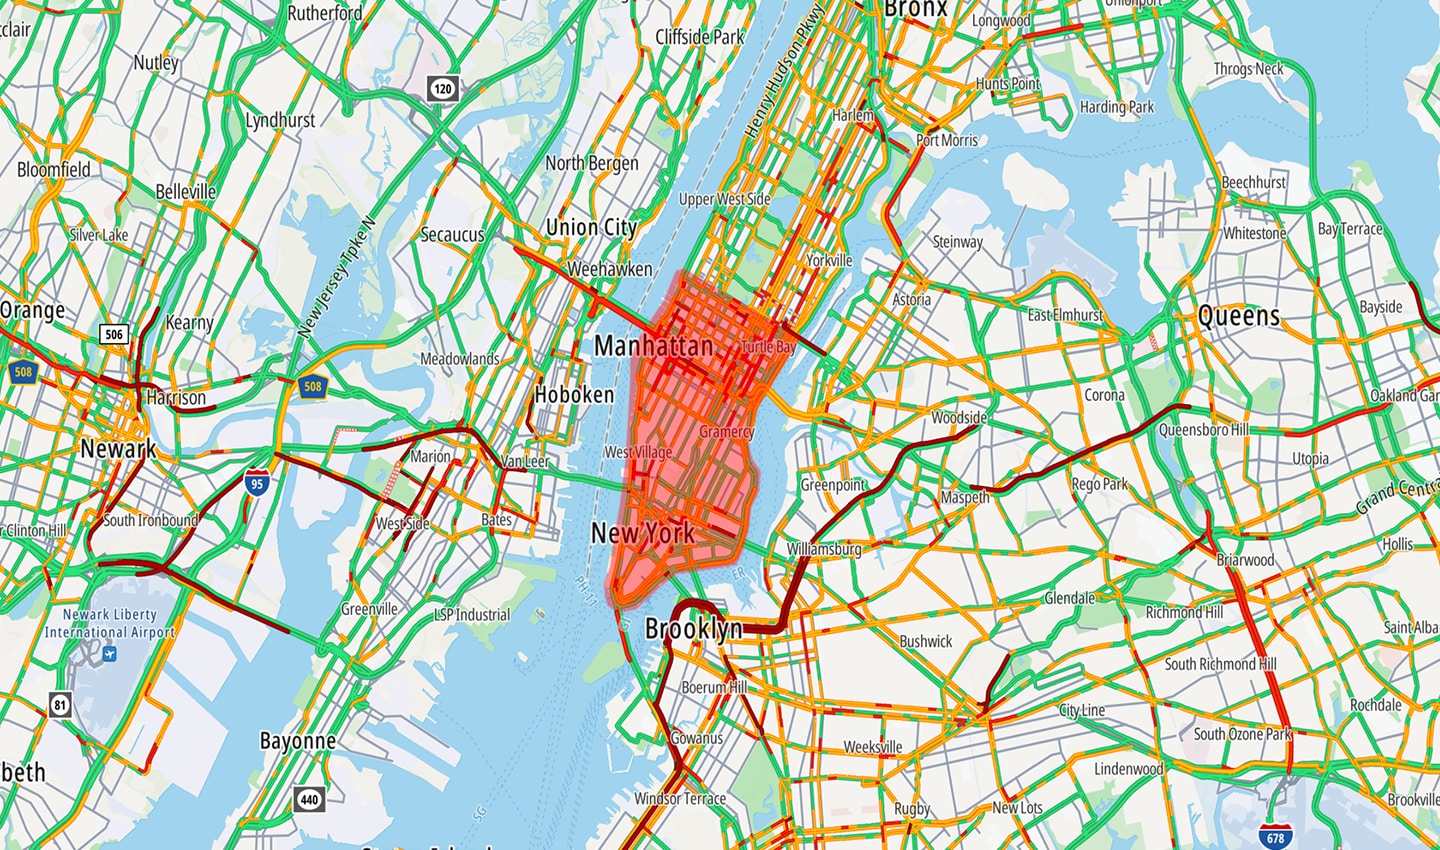 New York's Congestion Relief Zone in lower Manhattan.
New York State Governor Kathy Hochul said she hopes the measure will cut the number of cars entering the city by 80,000 every single day. While other cities have also faced opposition to congestion fees to begin with, their popularity has often increased as time goes on, especially if public transportation and support for other travel modalities improves as a result. But New Yorkers might not be so happy about the phased approach to charges, which are set to increase in the coming years and reach $15 by 2028. Some have expressed fears that the traffic will just spread out further, making air pollution worse in the Bronx and Staten Island, for example.
While it seems to be working now, the long term effects of New York’s congestion pricing remain to be seen. However, the TomTom Traffic Index does show that congestion in 2024 was a lot better in the wider metropolitan area of New York than in the city center, with the average time taken to travel 10 km at the more palatable 19 minutes and 16 seconds. Residents of those areas will be hoping the problem of congestion gets reduced city-wide rather than just being pushed out further from the center – and it will be interesting to see what the true effects are when the TomTom Traffic Index data is released next year. Will reductions in traffic continue?
Interested in how traffic moves in New York City? There's more data to dive in to.
People also read
)
London is the slowest-moving city in Europe again. Can the data show why?
)
TomTom Traffic Index: Why our approach can't be matched
)
Induced demand: The traffic paradox that we all need to know about
)
Pedaling through history: The resilient legacy of cargo bikes
* Required field. By submitting your contact details to TomTom, you agree that we can contact you about marketing offers, newsletters, or to invite you to webinars and events. We could further personalize the content that you receive via cookies. You can unsubscribe at any time by the link included in our emails. Review our privacy policy. You can also browse our newsletter archive here.