)
When I look back at the last two years of airport-area traffic data, I see a story unfolding in chapters, starting with the major holidays. Those weeks gave us a preview of just how differently airports respond to the same national moments, and they set the stage for what we would see throughout 2025.
2024: A preview of the year to come
Thanksgiving 2024 was one of the clearest examples of how polarized the country can be during peak travel. Around Ronald Reagan Washington National Airport (DCA), traffic surged nearly 38% above the baseline (the average travel time on the same airport access roads during a typical non-holiday week of the same year). Chicago O’Hare International Airport (ORD) and Los Angeles International Airport (LAX) traffic rose by more than 12% and Houston’s George Bush Intercontinental Airport (IAH) increased by 15%. But at the same time, airports like Boston’s Logan International Airport (BOS), Miami International Airport (MIA) and New York’s John F. Kennedy International Airport (JFK) ran faster than a typical week, improving between 9-14%. What struck me was how consistently airports fell into two categories: those that get overwhelmed by concentrated holiday traffic demand and those that disperse it. Christmas week only reinforced that pattern. LAX slowed again, this time by 14.5%, while airports like BOS, MIA and JFK again moved more smoothly. When two holidays tell the same story, you start to pay attention — because travelers are showing you how they behave long before the next year begins.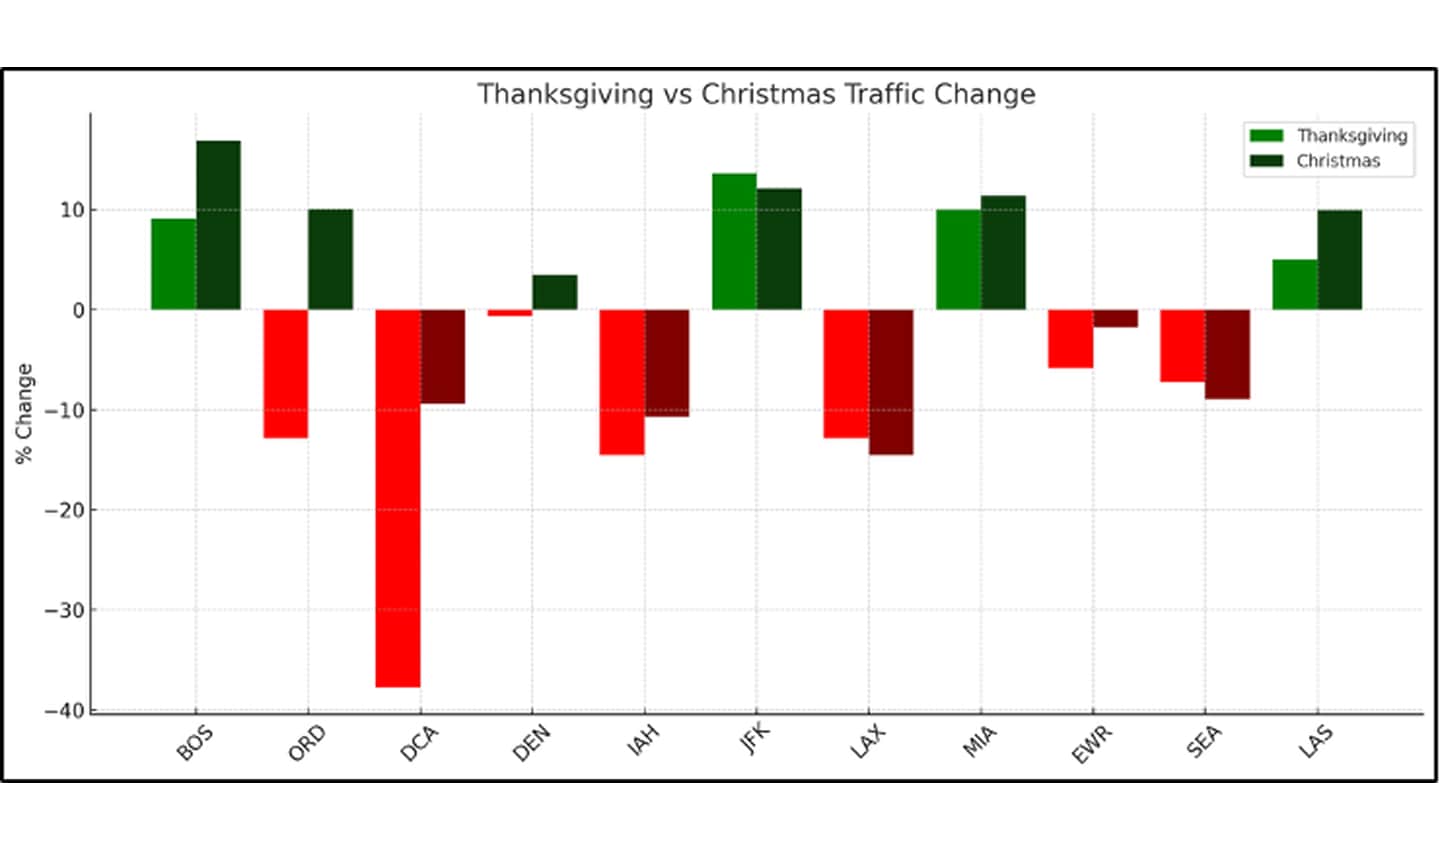 Some airports saw improved traffic conditions around end-of-year holiday periods, whereas others experienced greater levels of congestion.
2025 begins: Memorial Day confirms this pattern
By the time Memorial Day arrived in 2025, it was clear the behavior we saw in 2024 wasn’t a fluke. Airports in JFK, MIA, BOS, and Las Vegas’ Harry Reid International Airport (LAS) all ran 10–20% faster than their baselines, just as they had during the previous year’s holiday periods. Their traffic spreads out across long weekends rather than spiking. Meanwhile, IAH followed the opposite rhythm again, experiencing slower-than-normal conditions, particularly during afternoon and evening peaks. It was as if some airports had each settled into their roles, and those roles were remarkably stable.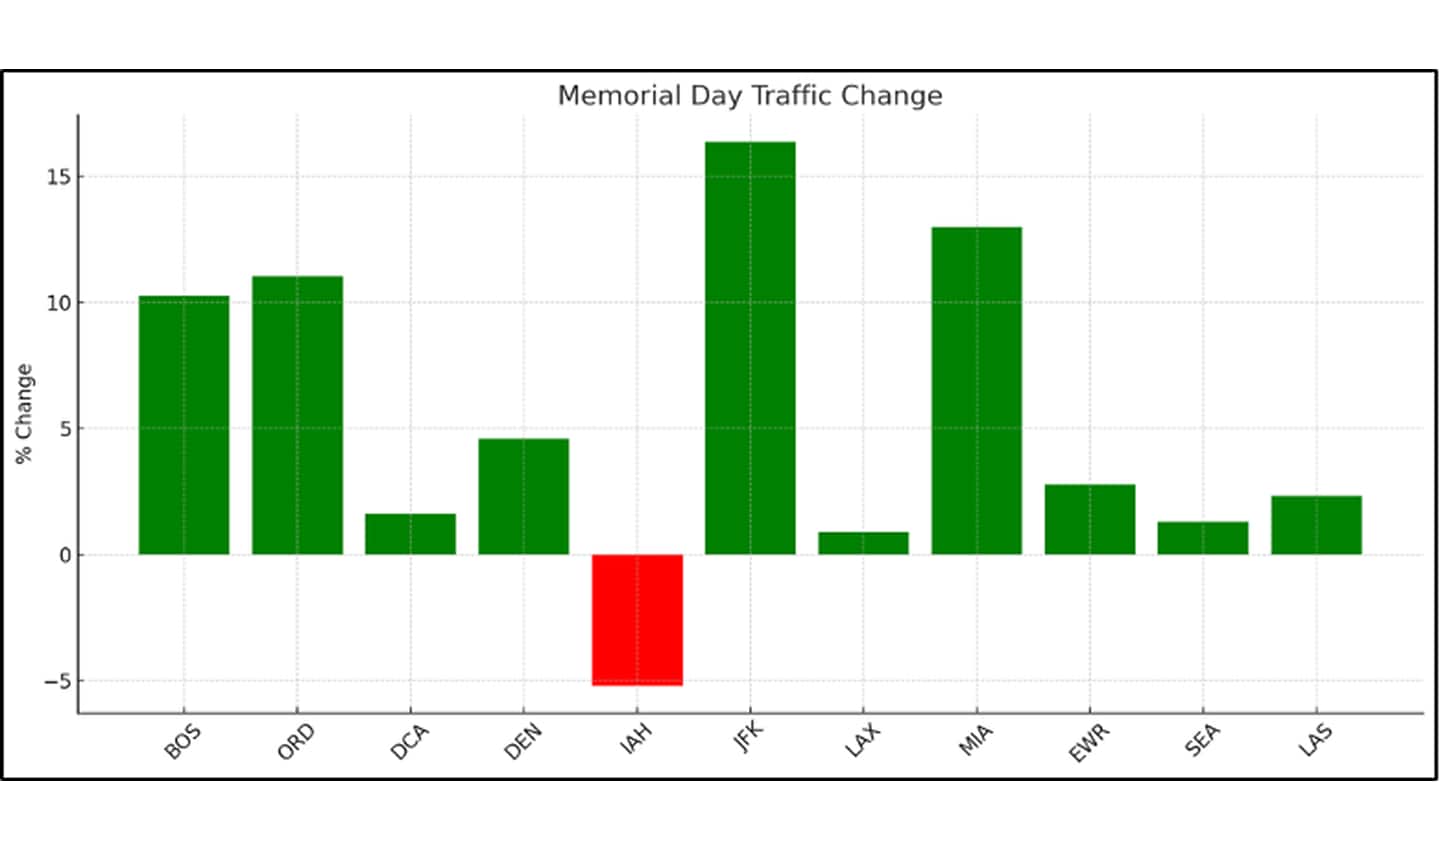 The holiday traffic patterns suggested in 2024 resurfaced on Memorial Day.
Independence Day and Labor Day: Two Americas on the road
That consistency carried straight through July and September 2025. Airports like BOS, ORD, DCA, DEN, JFK and MIA all ran faster than their baselines on both Independence Day and Labor Day, reinforcing the same easing we saw during Memorial Day. Their traffic continued to spread out across long weekends, leading to smoother conditions that closely mirrored their behavior in 2024. At the same time, only two airports consistently struggled: IAH and Seattle-Tacoma International Airport (SEA) saw slower-than-baseline conditions across both holidays, reaffirming the structural congestion we saw earlier in the year. LAX landed somewhere in between, worsening during Independence Day but improving on Labor Day. That split is consistent with LAX’s tendency to react differently depending on the timing of demand spikes — a reminder that even within national trends, each city’s network has its own rhythm.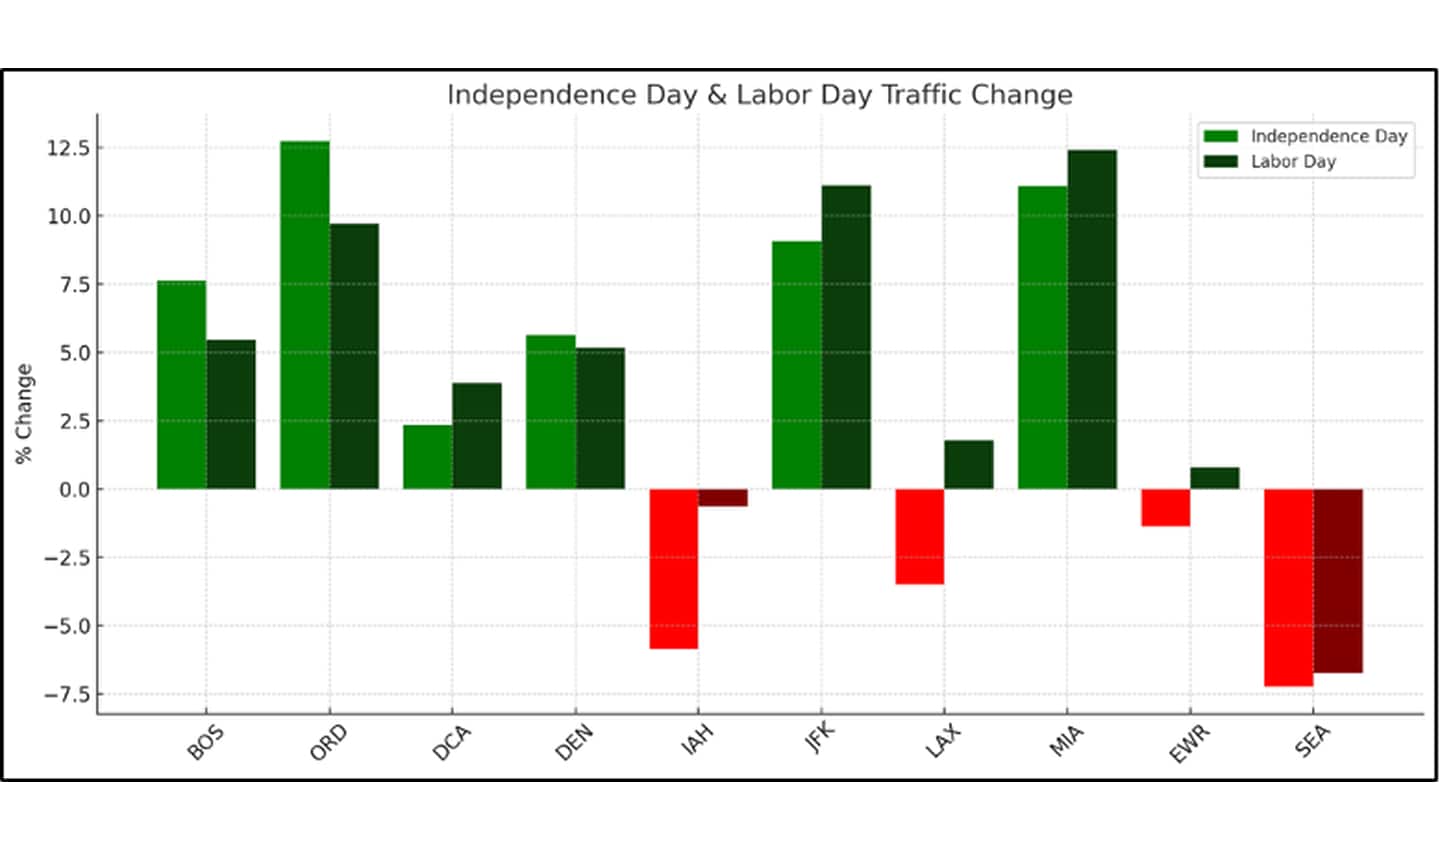 Independence Day and Labor Day further reinforced traffic improvement and congestion patterns, with LAX consistent in its deviation from national trends.
An unexpected occurrence: The November shutdown
Nothing in the holiday patterns, however, prepared us for the shift that happened during the federal shutdown in November 2025. Air travel disruptions were widespread, from cancellations to staffing shortages that left many travelers grounded. But for those who did reach the airport, road congestion was far lighter than normal in several major cities. BOS, ORD, DCA and LAS all saw consistently smoother conditions across both the morning and evening windows, offering a rare silver lining during an otherwise difficult travel period. Other cities saw only partial relief. Denver International Airport (DEN), IAH, JFK, MIA, Newark Liberty International Airport (EWR) and SEA all experienced lighter traffic during the 6–9 a.m. window but returned to heavier-than-normal congestion in the evening, reflecting a more uneven travel pattern during the shutdown. LAX remained the outlier: it worsened in the morning but improved in the evening — a reminder that LAX’s travel rhythms are uniquely resistant to the national trends we saw elsewhere.Across the shutdown period, the early hours of the day remained the easiest time to reach most airports, while mid-morning and early-evening periods stayed the most congested. Even during an event as disruptive as a federal shutdown, some travel rhythms are remarkably persistent. 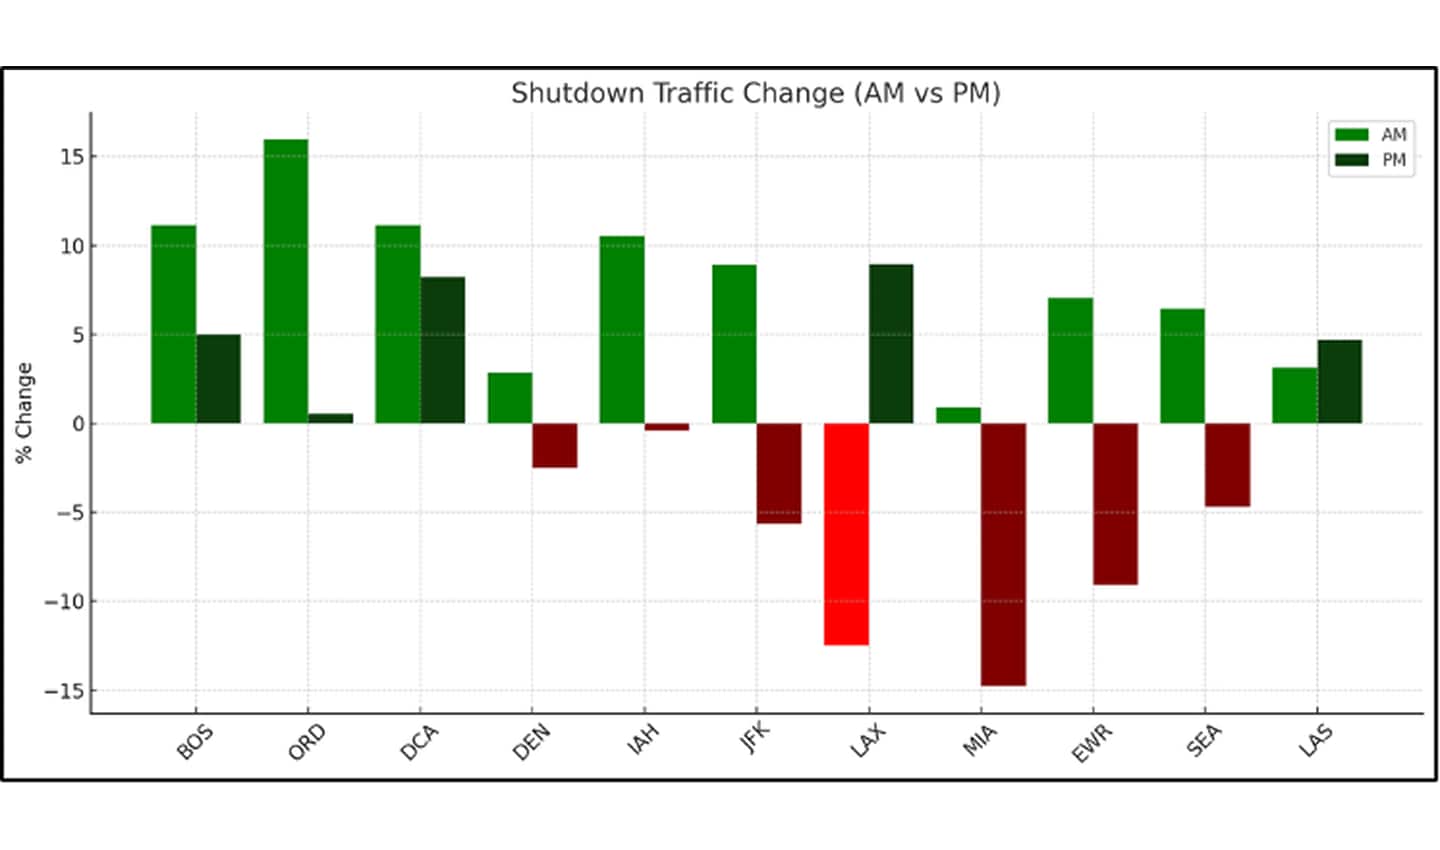 Despite the unusual circumstances, traffic flow remained fairly consistent with past patterns.
What this means for 2026 and beyond
What stands out most after reviewing trends over the years is just how consistent airport-area behavior is from one year to the next. Holiday patterns repeat. Summer trends repeat. Even time-of-day pressure points repeat. And when a major disruption occurs, like the November shutdown, the behavioral shift is immediate and measurable. That’s why having insights matters. When we can see how airports responded last year, we can anticipate next year’s pressure points with far more confidence. We already know which airports will ease during summer weekends, which will struggle during peak holidays and which will feel strain even when volumes drop. With that foresight, airports and DOTs can adjust staffing, routing, signage, curb management and operational planning before the stress arrives. Airport traffic is not unpredictable — at least not when you have the right data. And as we move into 2026, TomTom will continue monitoring these corridors in real time, helping cities and airports prepare earlier, respond faster and keep travelers moving more safely and efficiently.People also read
)
Launching Area Analytics: World leading traffic data visualized for sharper insights
)
Slowing down to move forward: Effects of lower speed limits across cities
)
Clearer roads, faster trips: The data behind NYC’s congestion pricing success
* Required field. By submitting your contact details to TomTom, you agree that we can contact you about marketing offers, newsletters, or to invite you to webinars and events. We could further personalize the content that you receive via cookies. You can unsubscribe at any time by the link included in our emails. Review our privacy policy. You can also browse our newsletter archive here.