See the true environmental cost of inner-city congestion with TomTom Traffic Index
&w=256&q=90)

It’s that time of year again, TomTom Traffic Index is ready. For the past 11 years, the geolocation technology company has been compiling data and crunching the numbers from more than 600 million devices to understand how traffic trends in the world’s major cities have been changing. This year for the first time, TomTom is also providing insight into the impact congestion has on the environment.
With its cost of congestion metric, TomTom’s data shows the volume of CO2 emissions seen in major cities that comes because of inefficient traffic flow. It gives insight not just into the impact that inner-city traffic jams have on the environment, but it also provides a window into the potential improvement that vehicle electrification can have on localized pollution.
TomTom’s data suggests that if we can find ways to reduce congestion in our cities, we could cut hundreds of tonnes of polluting CO2 every day in major cities around the world. While going electric is the long-term goal and will certainly reduce localized pollution to close to zero in cities, it will take a while until cities are fully electric. Until then, urban planners and governments around the world need to focus on reducing congestion and keeping traffic moving as smoothly as possible to tackle growing emissions.
Polluting cities and the cost of congestion
TomTom computed the cost of congestion for four key cities: Amsterdam, London, Paris and Berlin.
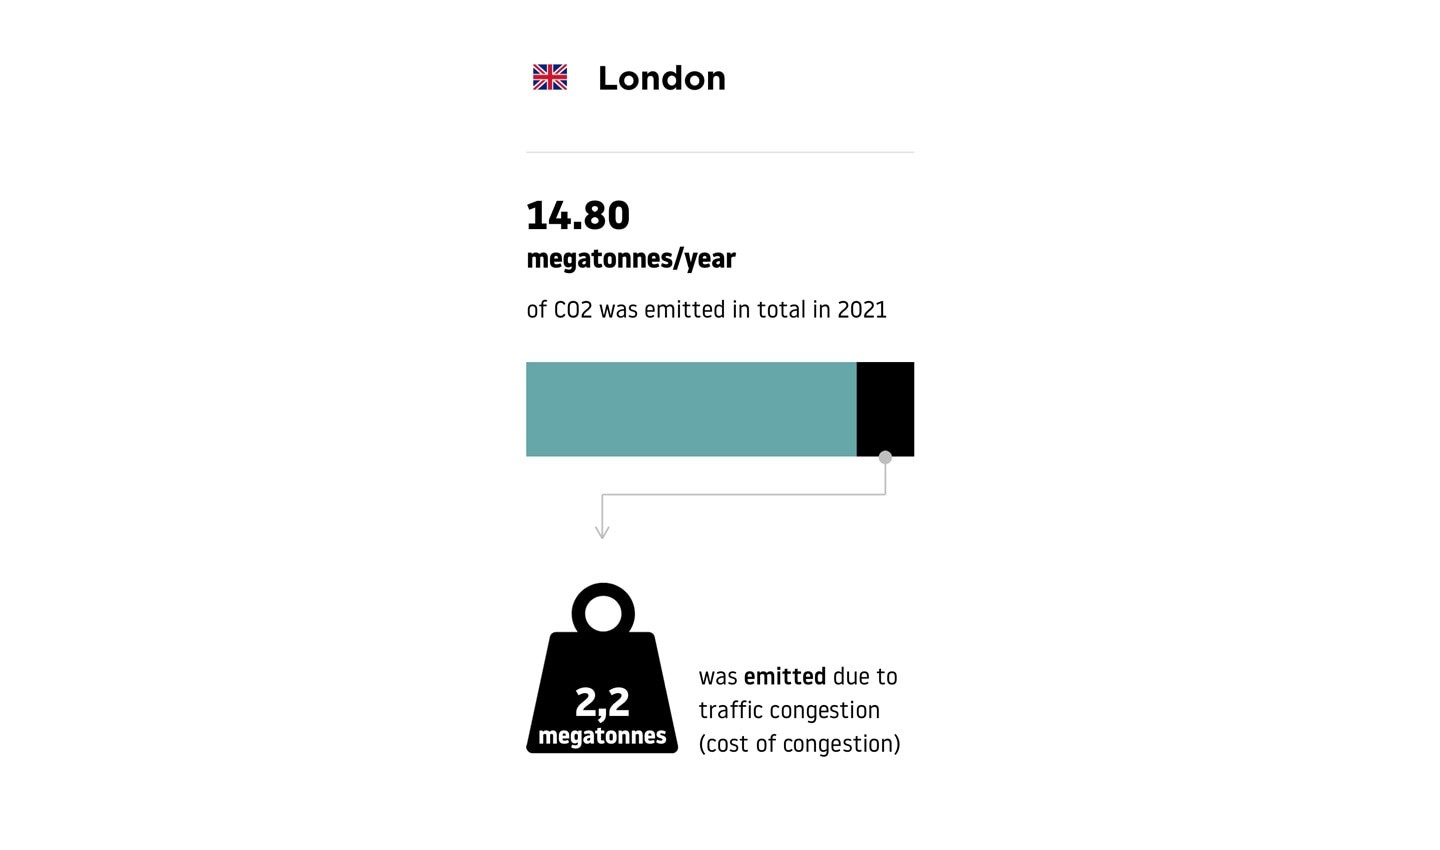
In London, UK, the estimated yearly cost of congestion is about 15% of total emissions. Over the year, some 14.8 megatonnes of CO2 are emitted in the British city by vehicles, 2.2 megatonnes (15%) comes as a result of inefficient traffic and congestion.
 To put that into some kind of context, to offset that 2.2 megatonnes of CO2 each year, we’d need a forest of pine trees the same size as Sydney, Australia.
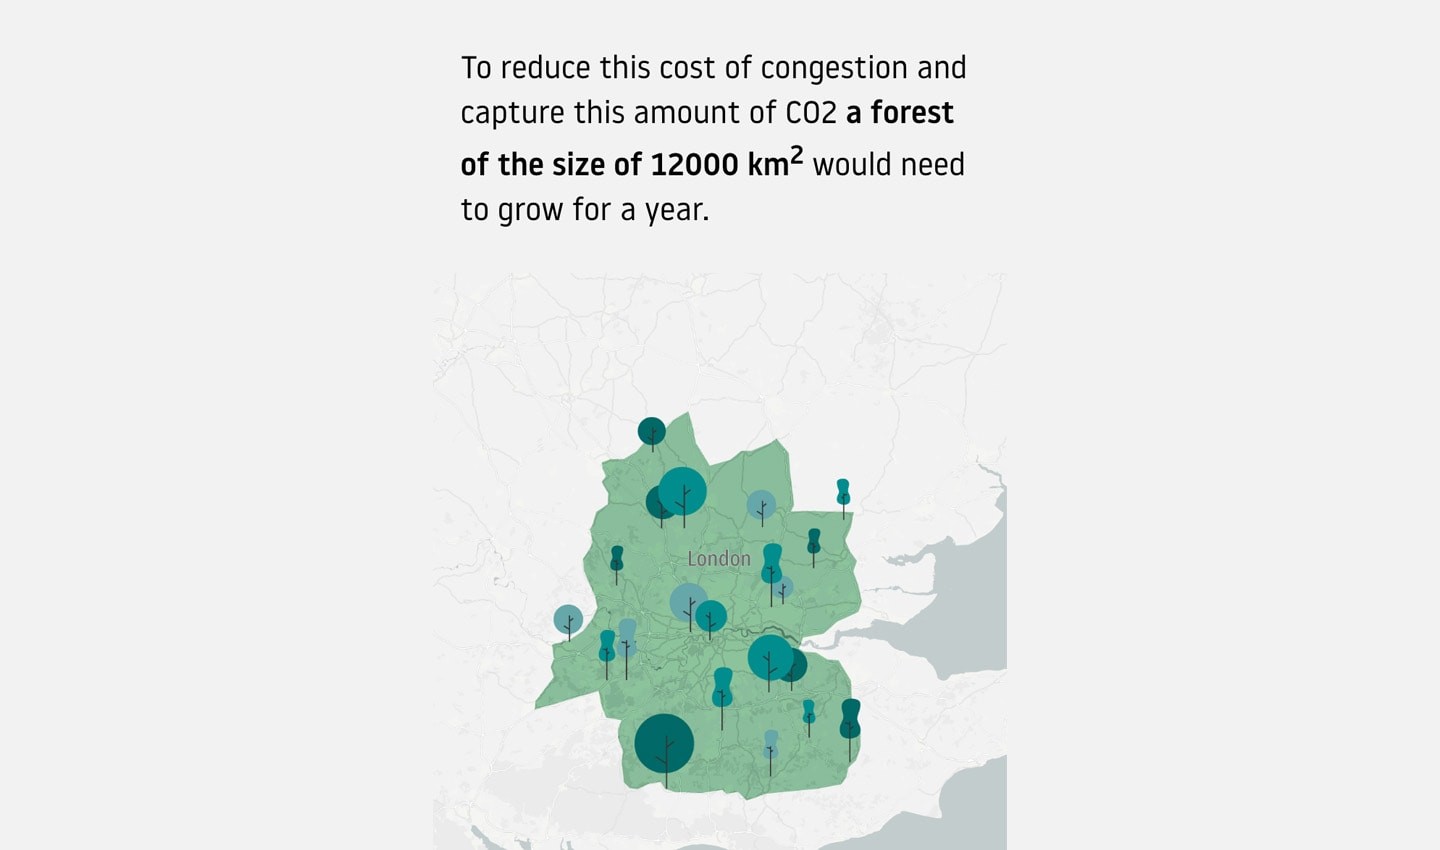 In Berlin, Germany 10.5% or 400,000 tonnes of its yearly CO2 (4 megatonnes) produced by traffic is the result of congestion. To offset that, we’d need a forest about one-tenth the size of Yosemite National Park.
 In Paris, traffic produces 21 megatonnes of CO2 each year, 2.8 megatonnes (13%) out of which is the direct result of congestion. In Amsterdam 60,000 tonnes of CO2 are produced by congested traffic, which is 7% of the city’s totally emissions (840,000 tonnes of CO2 per year).
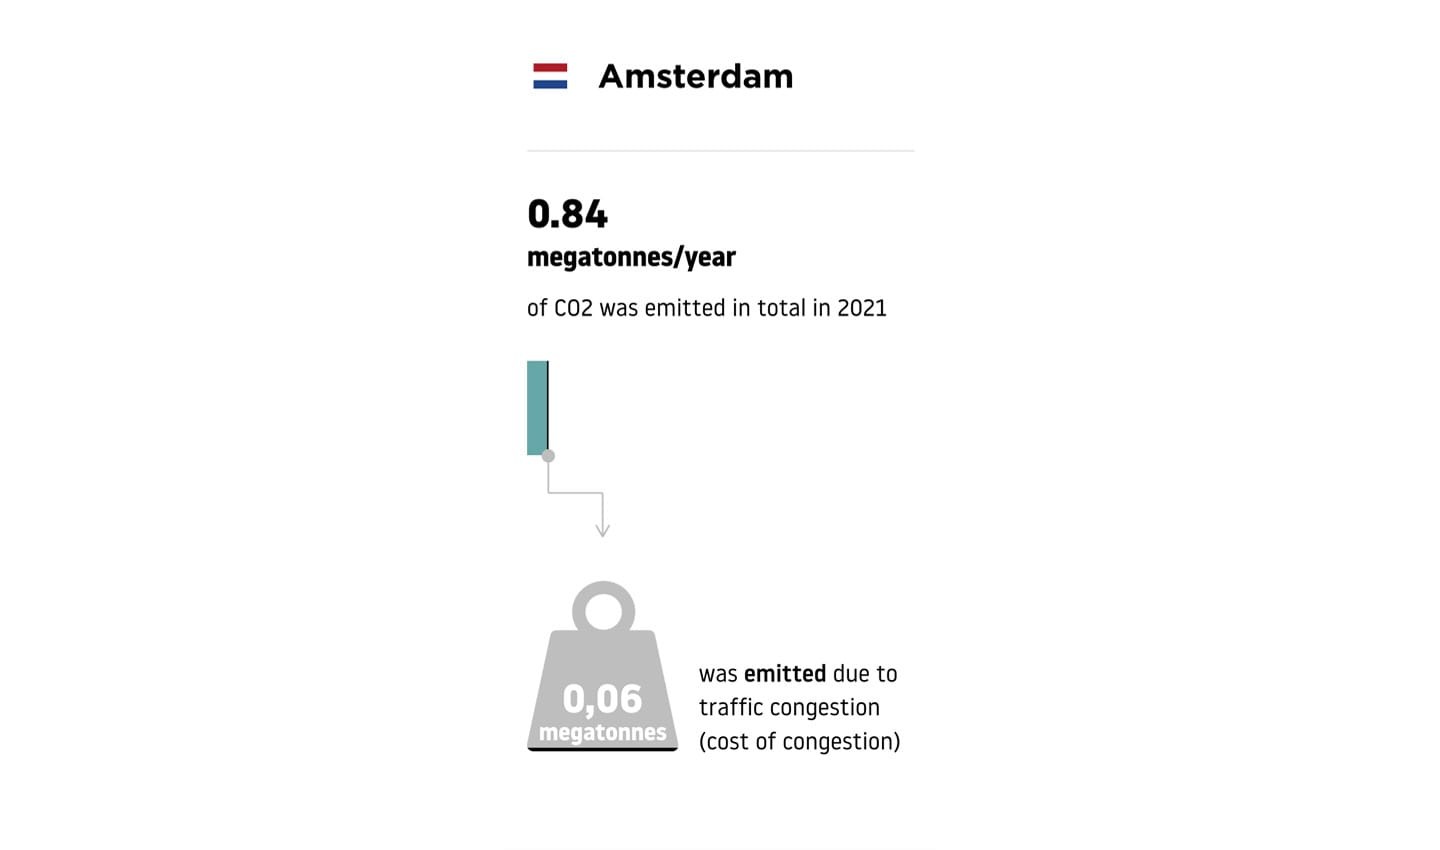
This cost of congestion is a measure of the extra emissions caused by traffic congestion. These are emissions that could otherwise be avoided if we found ways to just keep traffic moving, such as by limiting the number of vehicles allowed in cities, altering speed limits to smooth traffic flow and exploring new road designs and infrastructure that’s better at keeping vehicles moving.
The power of going electric
For the first time, TomTom is also able to use its cost of congestion model to predict and demonstrate the power that “going electric” would have on overall emissions. The company has put all the data into an easy-to-use simulator to see what difference going electric can make.
Take London, UK as the example: at present, the number of the electric vehicles on its roads is a small percentage of the overall fleet (including combustion engine vehicles), estimated to be around 4.4%. If the city were able to increase this number, by replacing combustion engine vehicles with electrically powered ones, it could reduce emissions and the cost of congestion dramatically.
In the case of London, if it could increase the ratio of EVs on its roads to just 10%, its overall inner-city emissions from traffic would drop by 1,540,000 tonnes of CO2 per year.
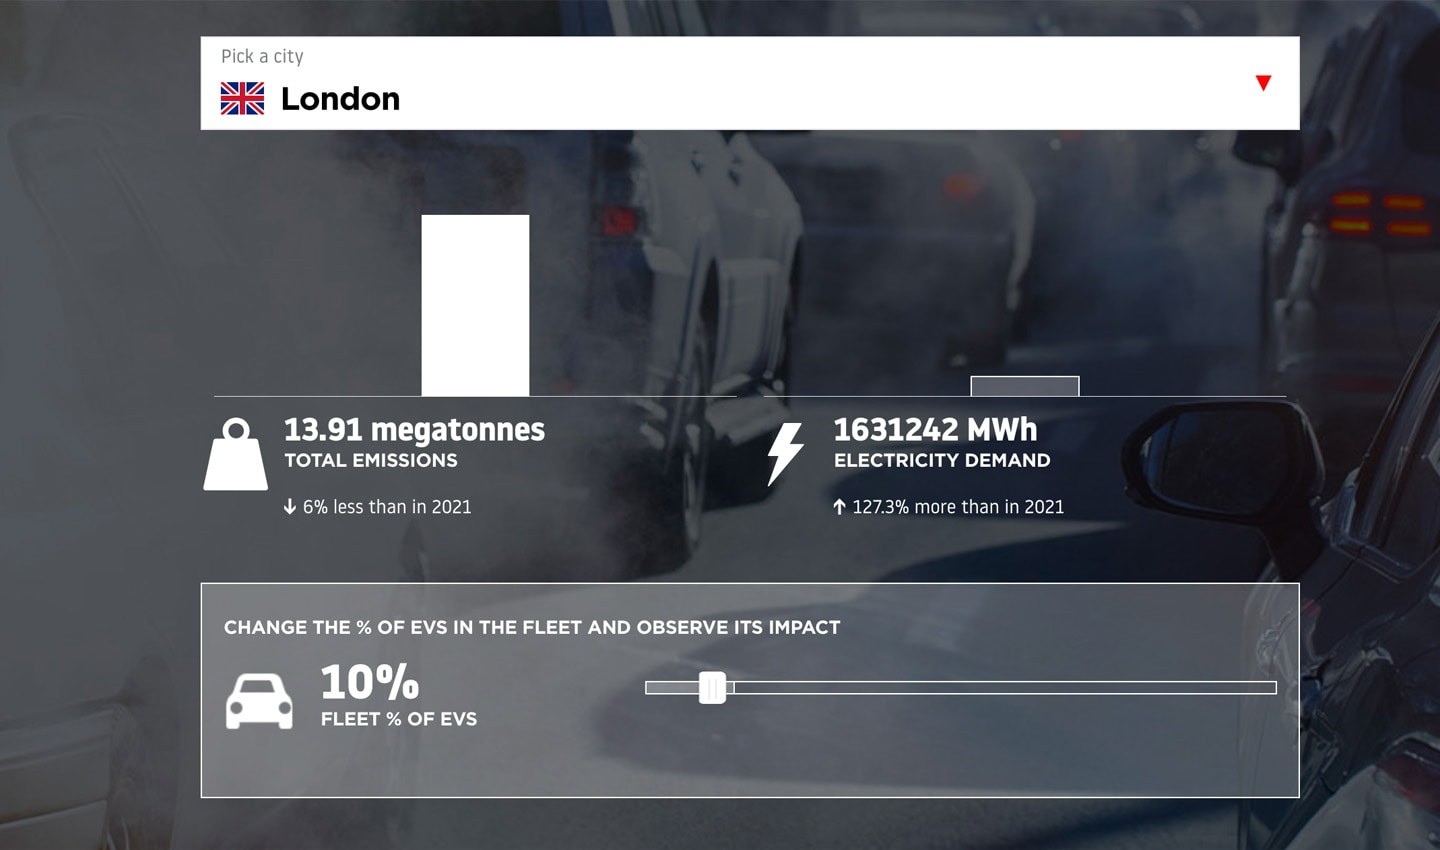
If London could increase it’s the share of EVs on its roads to 10% of its fleet, then emissions would drop considerably — by around 6%.
If Paris could increase the number of EVs on its roads by 1%, it would cut 220,000 tonnes of CO2 per year. In Berlin, it would cut 40,000 tonnes of CO2 per year. And in Amsterdam it would cut 9,400 tonnes per year.
Indeed, increasing a city’s EV vehicle fleet would increase its energy consumption considerably. Based on traffic volumes seen by TomTom, a 1% increase in EV fleet ration in Amsterdam, Berlin, Paris and London would equate to 10 GWh per year, 44 GWh per year, 231 GWh per year and 163 GWh per year, respectively.
It’s worth noting that these estimated reductions in CO2 per year focus purely on tailpipe emissions. Charging electric cars places additional demand on electricity grids, and as a result, emissions aren’t cut to zero. Indeed, the impact on overall emissions will be greater in countries that have a significant amount of renewables in their energy mix. In countries where the energy mix includes renewables and coal EVs still produce fewer emissions over their life compared to combustion engine vehicles, though.
How does TomTom compute emissions
In recent years we’ve become acutely aware of just how polluting combustion engine vehicles can be. However, it’s been hard to accurately understand the nuances of this and the true impact that electric vehicles will have on our cities.
Estimating emissions generated by traffic with a high degree of accuracy is no simple task. Ultimately the model’s output accuracy all comes down to the quality and breadth of data used as input. TomTom estimates the quantity of gases emitted using metrics like traffic volume, driving speed, traffic flow and vehicle fleet compositions. It also takes into account road gradients and classes, which are both known to affect emissions.
The company’s data has a 1hz resolution, in that it updates every second and covers a share of up to 40% of traffic in city centers.
To make a very complex calculation as simple as possible, essentially TomTom takes all this data, considers how and where vehicles drive, the type of vehicles and extrapolates that to create a city-wide estimation of emissions. If you want to know the full details on how the company calculates that, click here.
The future of inner-city traffic
Thanks to the fact that TomTom now includes emission data, we can see the powerful impact that switching to electric vehicles will have on our cities. The more people that go electric the better, as this will, over time, reduce tailpipe emissions dramatically. But that’s a long-term goal and we can’t sit and wait for the day to come when every vehicle is powered by electricity.
More importantly, TomTom’s Traffic Index highlights how we can impact emissions now, and how other strategies, like strong governmental policies and infrastructure optimization, can reduce emissions in the near term.
People also read
)
Do low emission zones work? TomTom Traffic Index has the answer
)
Here are the world’s most congested cities according to the 2021 TomTom Traffic Index
)
The changing shape of inner-city traffic: How COVID-19 changed the way we move in 2021
* Required field. By submitting your contact details to TomTom, you agree that we can contact you about marketing offers, newsletters, or to invite you to webinars and events. We could further personalize the content that you receive via cookies. You can unsubscribe at any time by the link included in our emails. Review our privacy policy.