)
The coronavirus pandemic has changed a lot. We’ve been forced to alter and adapt the ways we approach work, socializing, shopping and transport. This is reflected in TomTom’s Traffic Index, which, for 11 years, has tracked congestion in our cities. With the pandemic throwing most things into disarray, the company’s Traffic Index goes beyond just monitoring congestion. It is now serving as a barometer for economic recovery and social change in our cities.
This year, TomTom Traffic Index is telling one of its most interesting and detailed yearlong stories, about how we move in our cities and the impact traffic has on them. Before the pandemic hit, TomTom Traffic Index told a seemingly unchangeable story. This is no fault of the location tech company, but rather a result of tracking and reporting on a world that was, in terms of traffic, set to grow exponentially.
This year’s edition marks TomTom’s 11th Traffic Index, but many of the editions that preceded it showed a similar story every year: that traffic is increasing, and congestion is getting worse.
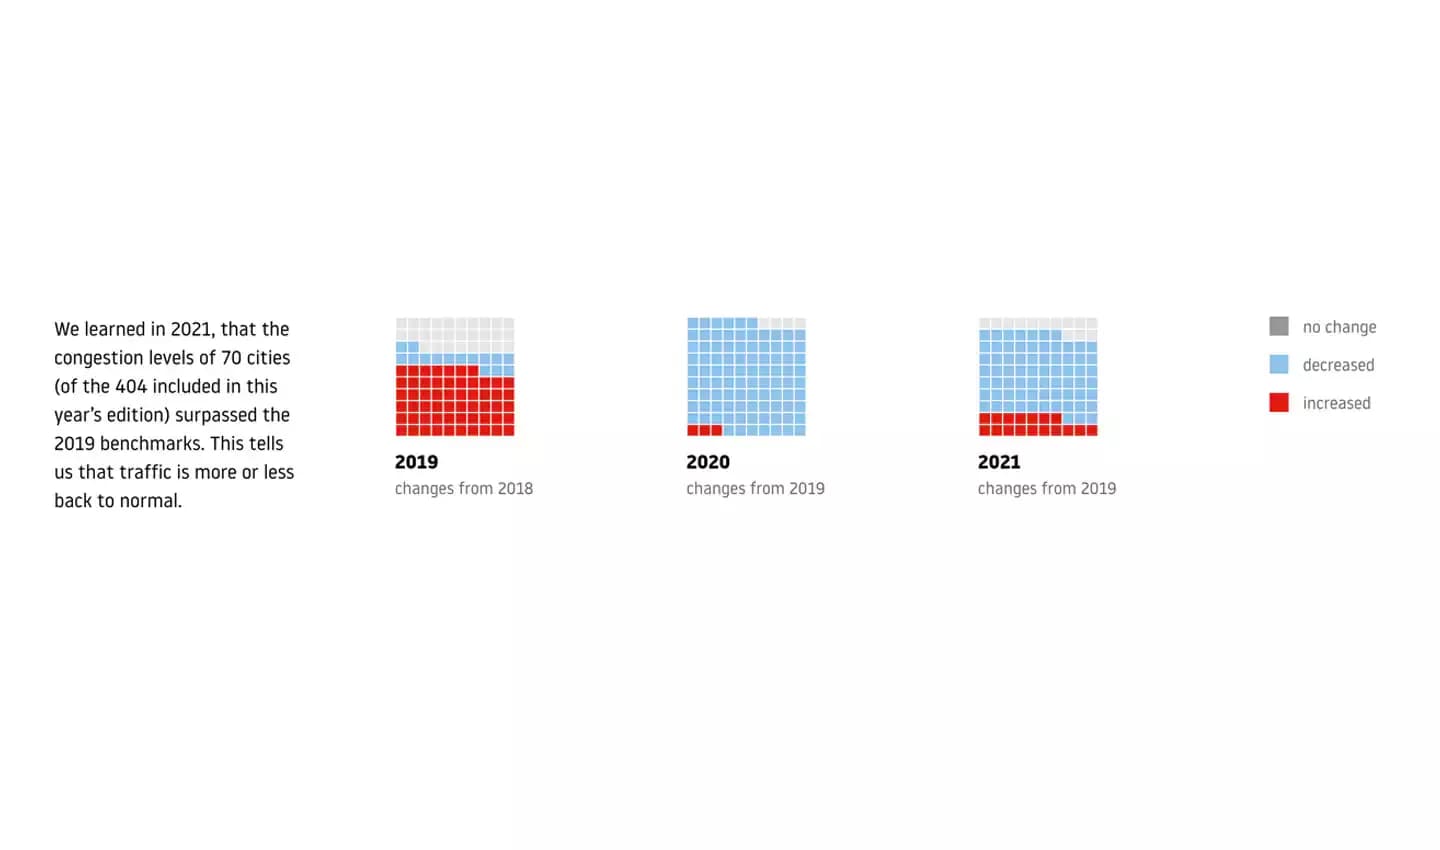
For the first nine editions of the Traffic Index, data showed that congestion was increasing globally, on average by around 2-3% each year. However, when COVID-19 struck two years ago, that trend was upended, as the past two editions of the TomTom Traffic Index have shown. If you want to know more about how congestion and traffic has changed, click here.
The barometer of economic recovery
As the pandemic struck, we saw traffic levels drop to lows that we’ve not seen in generations. You can read more about that here. Lockdowns turned cities into ghost towns, and we got to see firsthand what a city without commuters would look like — there was 19% less congestion globally. However, that scene would never last forever, and we’re now beginning to see recovery.
It was quite obvious when traffic started returning to our cities, but thanks to the data gathered by TomTom as part of its Traffic Index, we can see the bigger picture of what that means and what that economic recovery looks like.
Two ways the pandemic is reshaping our cities
When traffic began to return to our streets, it returned in a different form as to when it left. Two things appear to have happened: we now favor private transport more than before, and traffic density is spreading out throughout the day.
Due to the pandemic, public transport lost its allure as many opted for socially distanced forms of travel. Cities like New York, USA, Paris, France, and London, UK, took the opportunity to build new cycle lanes and low traffic neighborhoods to promote e-scooter and bicycle use. Low emission zones, a way of keeping the most polluting vehicles from city centers, have become a hot topic too. While these strategies have contributed to some reductions in traffic within cities, interurban movement has continued to be an issue for congestion.
Many interurban travelers appeared to prefer their own private cars over public transport, most likely for their relative safety and isolation during the pandemic. This led to sharp increases in congestion in cities when lockdown restrictions were lifted, and people had a reason to leave their homes. For example, in September 2021, traffic in Paris, France, was 10% higher than it was in September 2019.
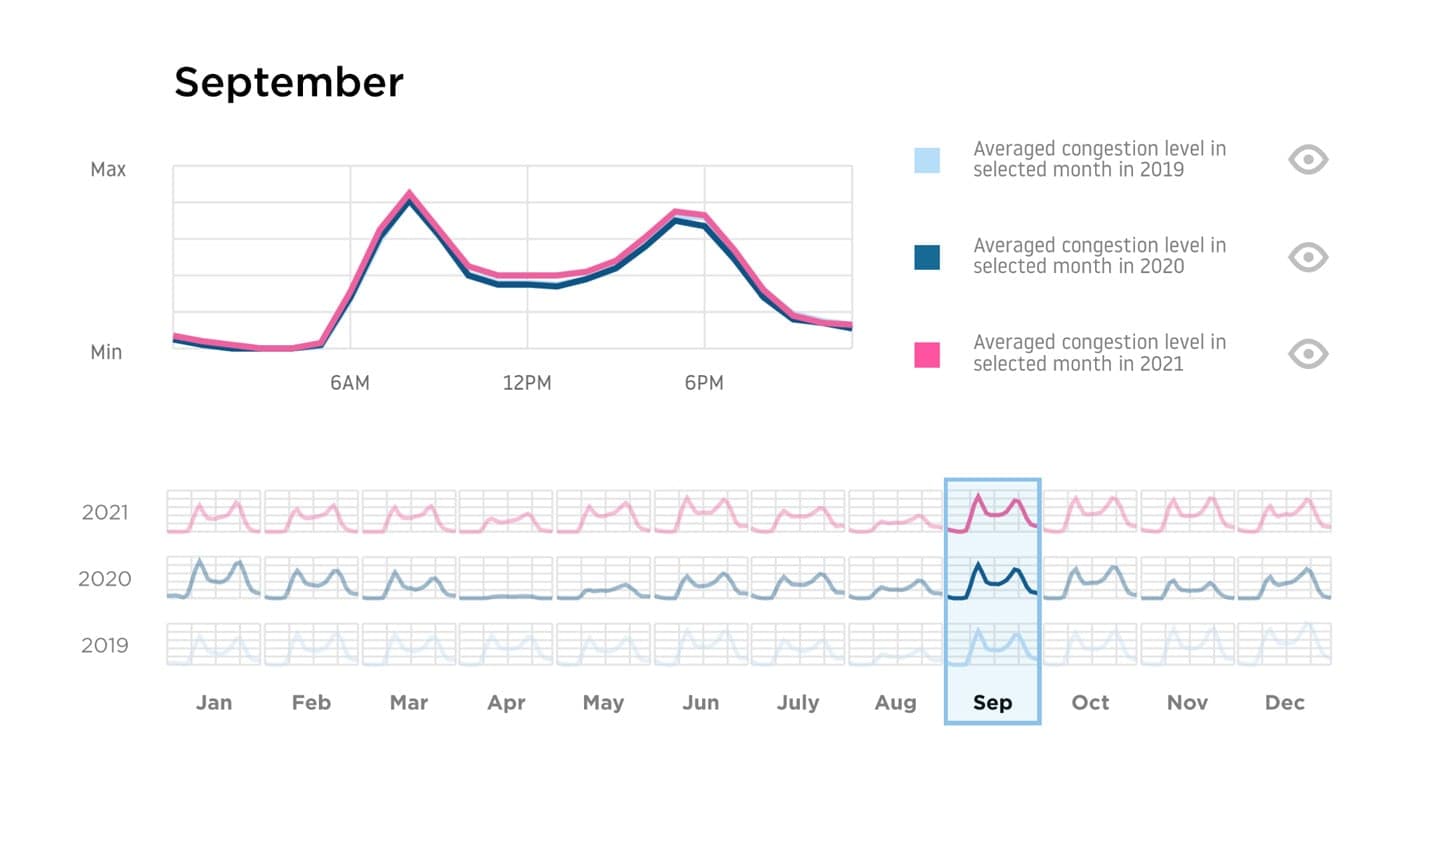
September traffic in Paris, France, was higher in 2021 compared to 2019. This is despite many people still working from home. Traffic in the middle of the day increased the most.
With many of us choosing to work from home, we were gifted the opportunity to do more online shopping and be at home to receive our packages when they were delivered. While this reduces traffic in one sense, as we’re not traveling ourselves to go shopping, it increases traffic in another sense.
TomTom says that one of the reasons traffic levels have spread out through the day is due to our online shopping habits. Indeed, while an increase in traffic levels shows that cities are reopening and recovering economically, the spreading of traffic is another marker that local economies are recovering, albeit in a slightly different form.
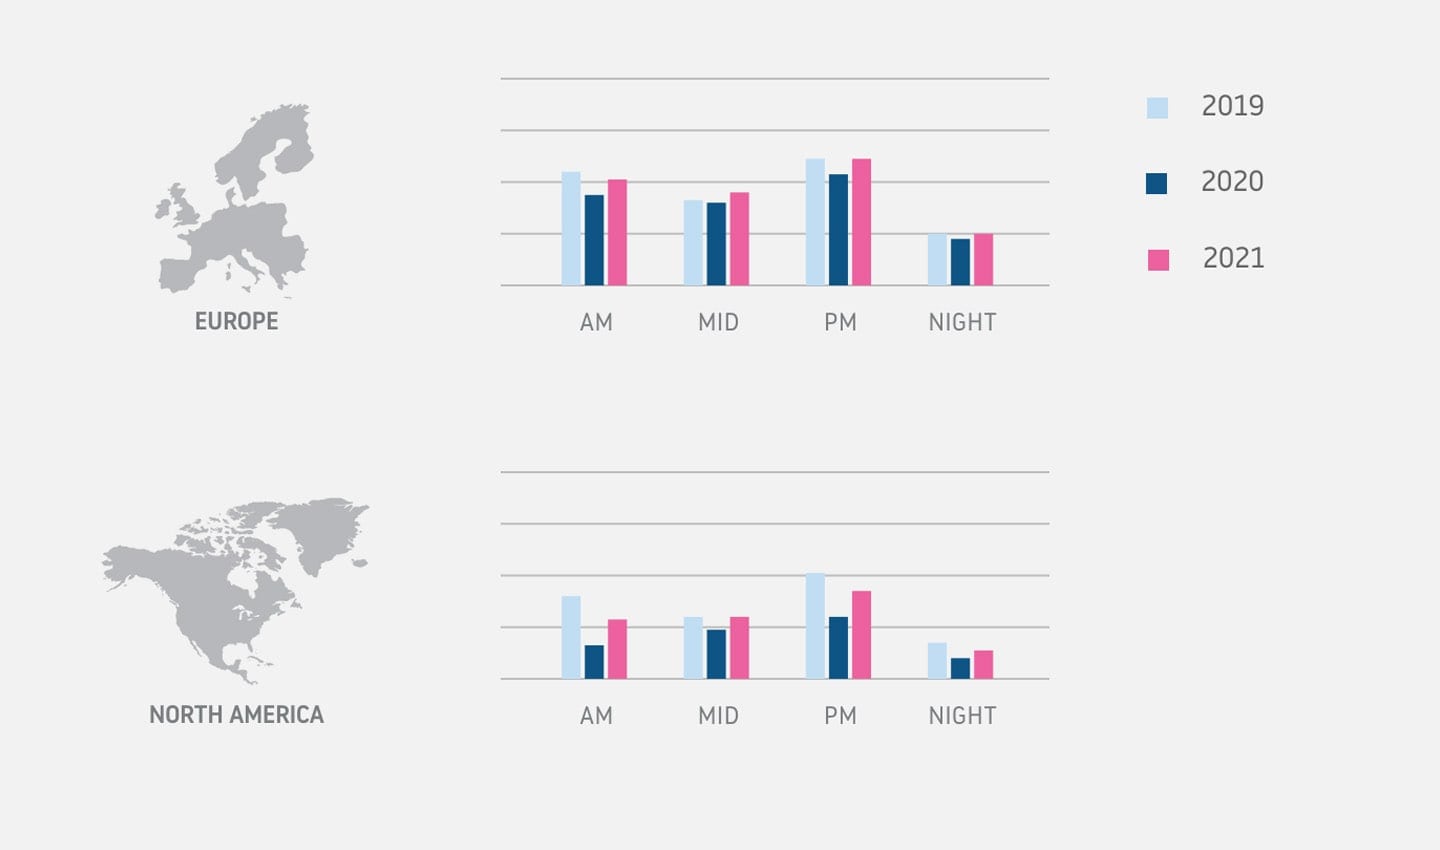
Traffic levels throughout the day vary a lot less than they used to.
In some countries, like the U.S. or the United Kingdom, cities have seen traffic spread throughout the daytime, alongside a decrease in peak hours. “This can partly be explained by the boom of e-commerce,” said Ralf Peter Schäfer, VP Travel and Traffic at TomTom. “The COVID crisis has acted as a catalyst that increased the speed of change in our way to consume. The last-mile sector is experiencing a massive transformation driven by increasing customer requirements who demand more immediate or same-day deliveries and return options.”
What will the future look like?
Even though drivers prefer private cars over public transport, and congestion is returning to our cities, the solution is not to build more roads. Building roads does not ease congestion, rather it creates a place for more congestion.
The future, as we emerge from global coronavirus lockdowns, must be built with more consideration, more intelligently. Low emission zones, low traffic neighborhoods and improved cycling infrastructure are all proving to have a positive effect on cities. Indeed, the challenge city planners now face is knowing where to build this infrastructure for the best effect, and how to track its performance and show that it’s had a positive impact on congestion and emissions.
Thankfully, companies like TomTom provide data for both ends of this equation. Using sensor data from vehicles and GPS devices, we can see how roads are used in real time. The company’s Traffic Index is proof of that. Monitoring this over time allows us to see the impact that infrastructure changes make.
Schäfer explains the situation, “To achieve a fundamental improvement, the modal split must be changed: cycling, public transit and other modes of transport must take a larger sharing in transportation. Such a redirection is a political task that requires both high investment and bold political decisions – and it takes time.”
People also read
)
Do low emission zones work? TomTom Traffic Index has the answer
)
Here are the world’s most congested cities according to the 2021 TomTom Traffic Index
)
See the true environmental cost of inner-city congestion with TomTom Traffic Index
* Required field. By submitting your contact details to TomTom, you agree that we can contact you about marketing offers, newsletters, or to invite you to webinars and events. We could further personalize the content that you receive via cookies. You can unsubscribe at any time by the link included in our emails. Review our privacy policy. You can also browse our newsletter archive here.