)
TomTom’s 2021 Traffic Index, released this month, shines a light on the world’s most congested cities. Most interesting for this edition, is that we get to see how reopening the world from COVID-19 lockdowns affected congestion in our cities. Are we returning to normal? Or have our travel patterns changed forever?
Overall congestion, still down compared to pre-pandemic levels
Despite there being a brief moment of respite from COVID-19 across summer — before the Delta and Omicron variants took hold — traffic and congestion levels were still lower than they were ‘pre-pandemic’. Most notable, though, is how much traffic levels have dropped during peak hours.
Overall, global congestion levels are 10% lower than they were in 2019, before the pandemic struck. During peak hours, AKA rush hours, global congestion levels were 19% lower than they were in 2019.
Indeed, according to TomTom’s data, some 387 of the 404 cities analyzed displayed lowered congestion than in 2019.
While traffic saw an average decrease of 21% around the globe in 2020, congestion during rush hour was down by 28%. This shows that while traffic levels have increased since 2020, they’re still not back to pre-pandemic levels. However, most of those increases in congestion came as part of massive fluctuations in traffic levels, the result of cities going into and coming out of pandemic lockdown measures.
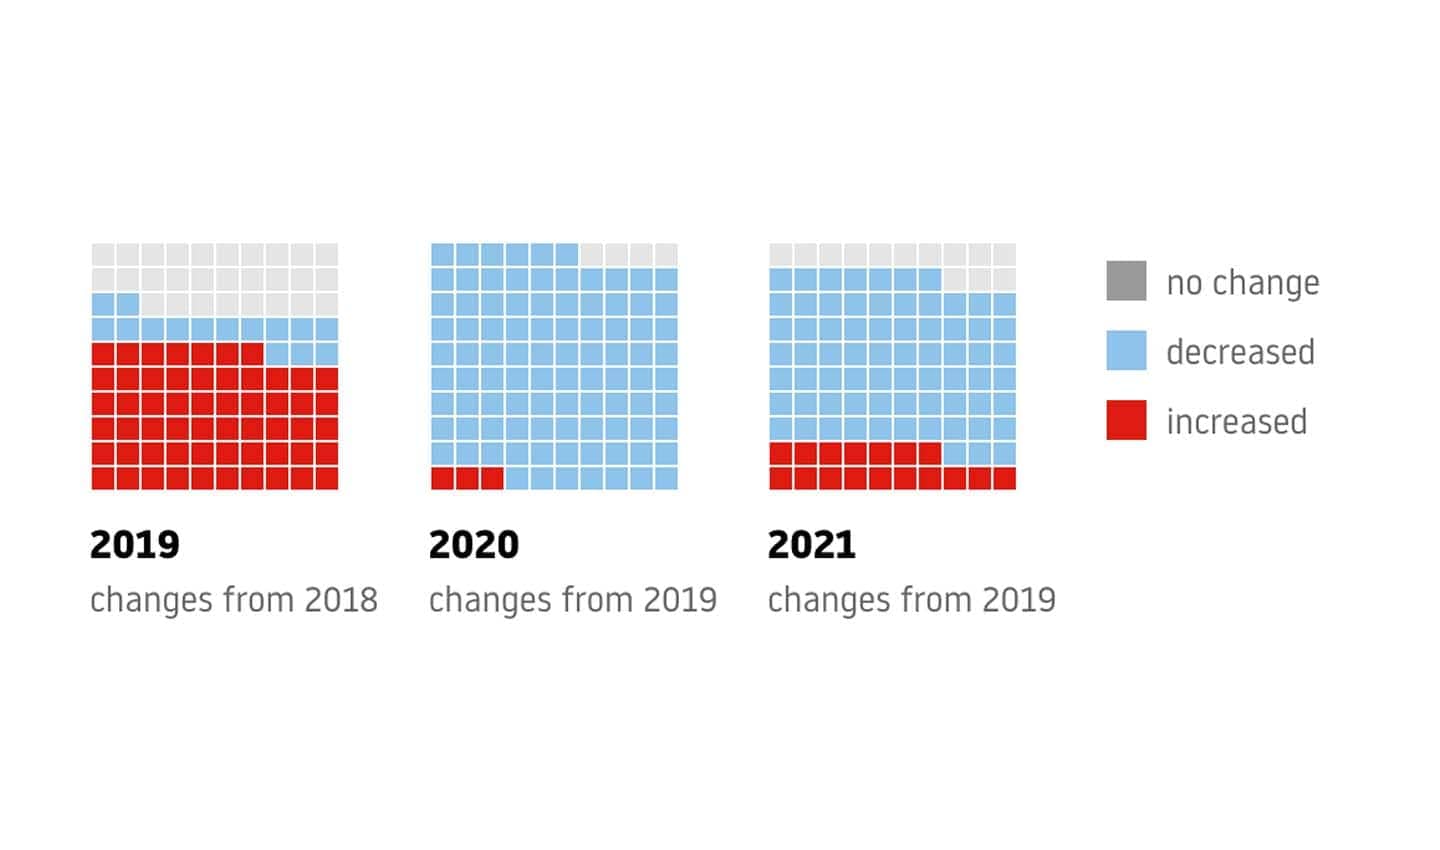
As we can see, traffic levels are beginning to increase again. With more cities beginning to show an increase in traffic compared to pre-pandemic levels.
In 2020, TomTom’s experts predicted the end of the rush hour as we used to know it. Their prediction seems to be holding up so far. In more than a third of the world’s cities traffic levels at peak hours have either decreased, or shifted, compared to pre-pandemic times. TomTom Traffic Index says that in 158 of the 404 cities tracked, traffic at peak hours has shifted or decreased.
While overall congestion has increased since last year, mostly due to local lockdowns lifting during summer, it’s still less than in pre-pandemic years. The more significant decrease — in congestion during rush hours — has been maintained, suggesting that a vast majority have continued to work from home and that the rush hour we used to know may well be a thing of the past. Which, given what we know of the cost of congestion, can only be a good thing.
As the following chart shows, one of the clearest trends is how peak hours have shifted. In U.S. and Canadian cities peak hours shifted by up to four hours in the morning, leading to a reduction in traffic early in the day, but an increase in congestion later on.
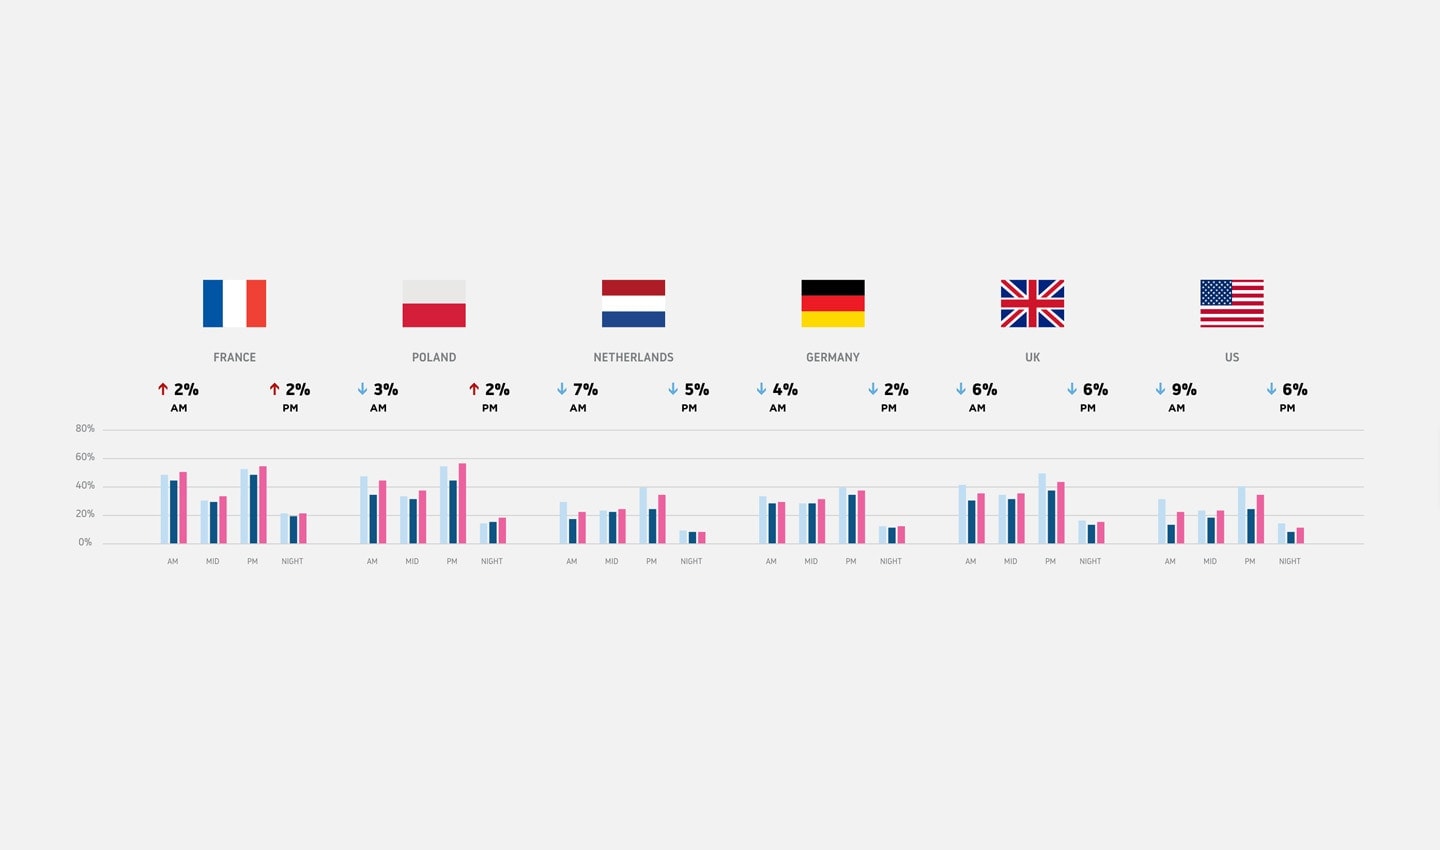
One of the clearest global trends is in the shift of rush hour.
Even if congestion has increased since 2020 — that’s to be expected as lockdowns ease — the fact that congestion is still less than it was before the pandemic is something to consider a positive. For the nine editions of the Traffic Index that preceded 2020, congestion levels around the world had been increasing by 2-3% every year.
The pandemic has caused much heartache and economic strife around the world, but it has also recalibrated how we travel in our cities. With lower levels of congestion and less traffic during rush hours, it might point towards a brighter future for our roads.
The world’s most congested cities
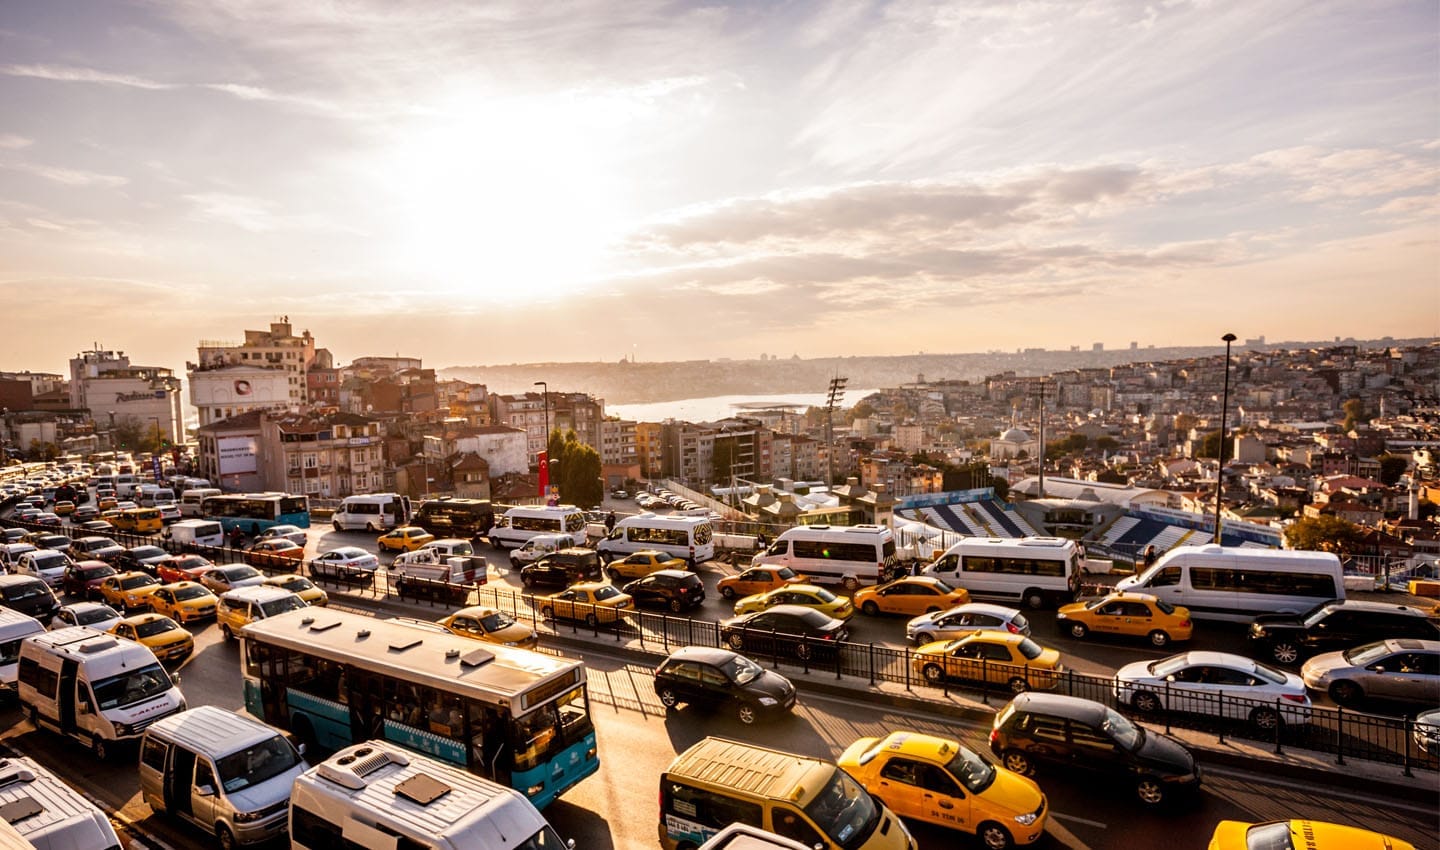
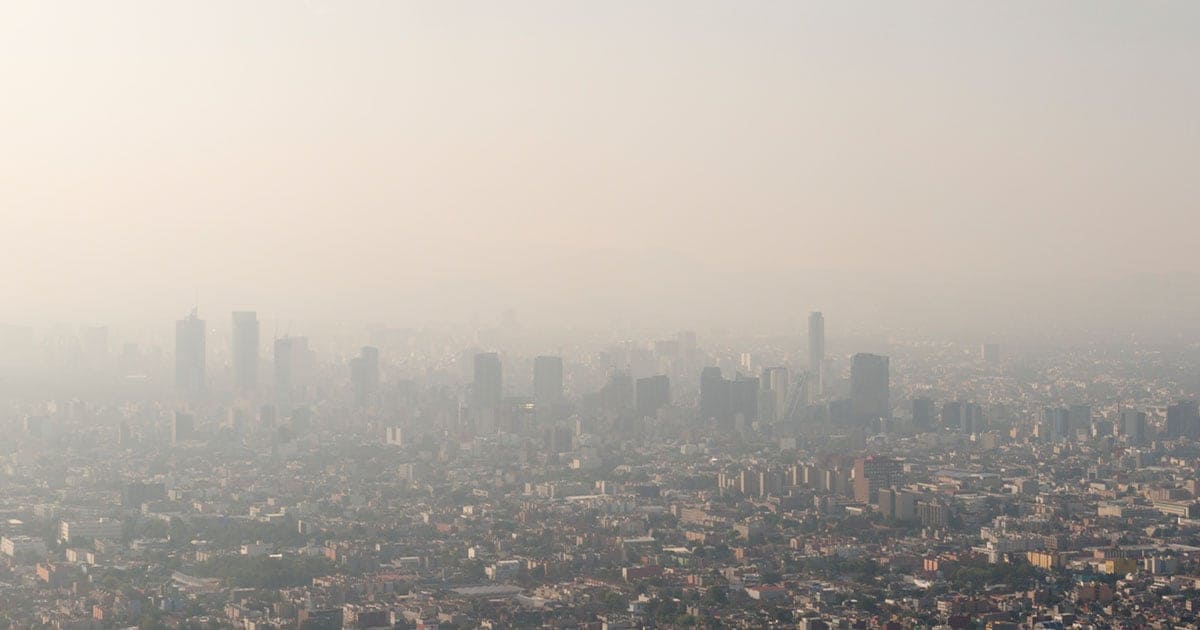
Istanbul, Turkey’s largest city and financial capital, was the most congested city in the world in 2021.
If you’ve been following the Traffic Index for any of its past 10 editions, this past year’s most congested cities won’t come as a surprise. 2021’s most congested cities are frequently in the global top ten of countries most likely to have you reaching for your car horn.
In 2021, Istanbul, Turkey, took the number one spot as the world’s most congested city, with an average 62% congestion rate.
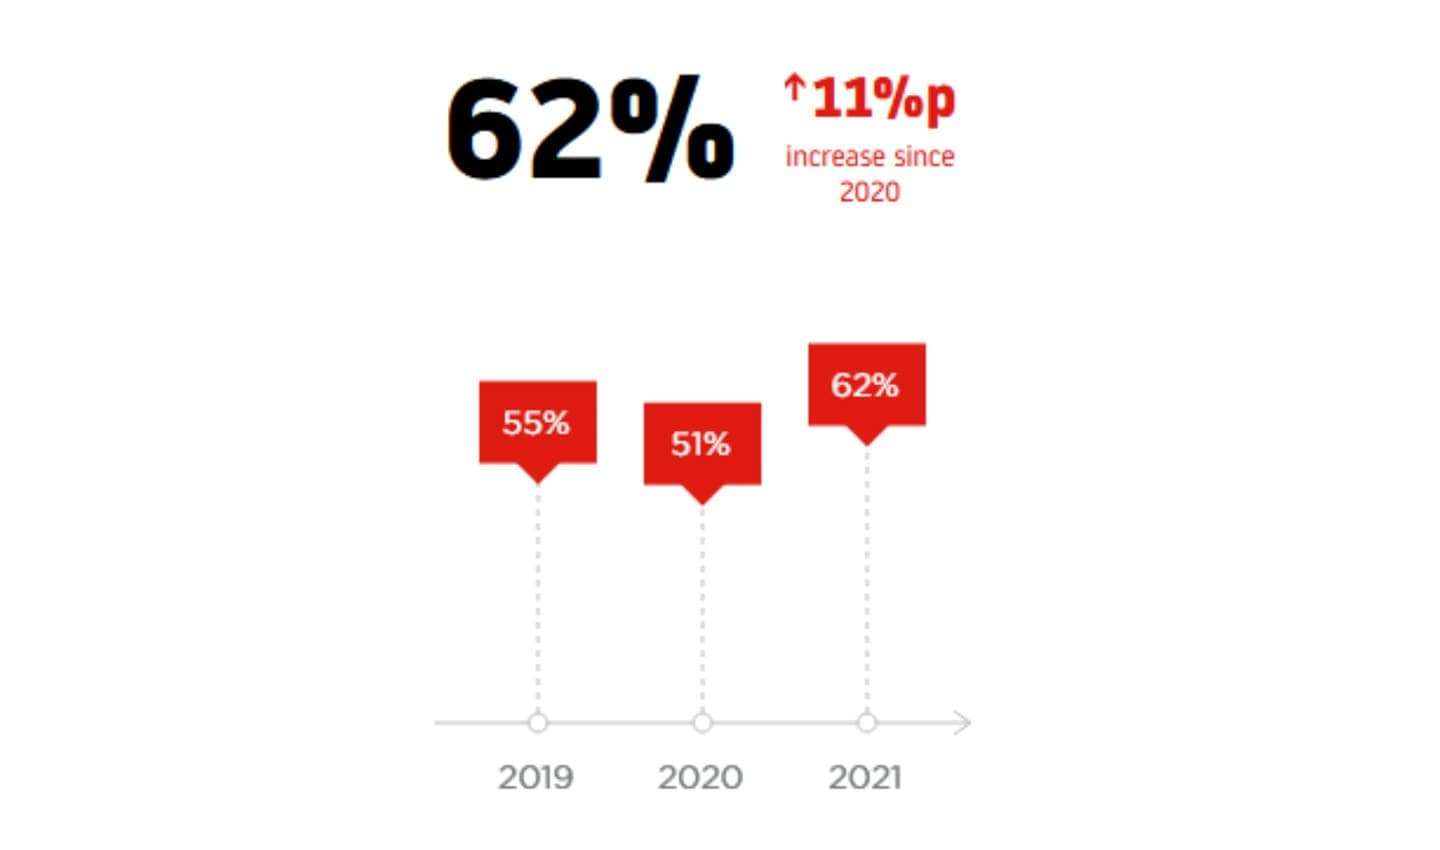
While Turkey was home to the world’s most congested city, the entire country also showed levels of congestion greater than before the pandemic, showing a big swing back from lockdown.
Moscow, Russia, which was 2020’s most congested city with a 54% congestion level, is 2021’s second most congested city. In 2021 the Russian capital saw an average congestion rate of 61%.
It’s worth noting that Russia’s approach to coronavirus lockdowns was quite different from many other parts of the world. The country had one of the shortest lockdowns during the initial early-2020 coronavirus wave and it continued to resist such measures in favor of enforcing other protocols, such as mask wearing and hand sanitizing during the second and third waves that affected much of 2021. Russia was also one of the first to roll out a state-approved vaccine, giving it an upper hand when ‘returning to normal’.
The spot for the world’s third most congested city is a tie between Kyiv, Ukraine, and Bogota, Colombia, each with a congestion level of 56%.
Weather worries
Congestion, traffic and its emissions have a well-known documented impact on the environment. Those impacts came full circle in 2021 as extreme weather affected road networks around the world, and further exacerbated traffic congestion.
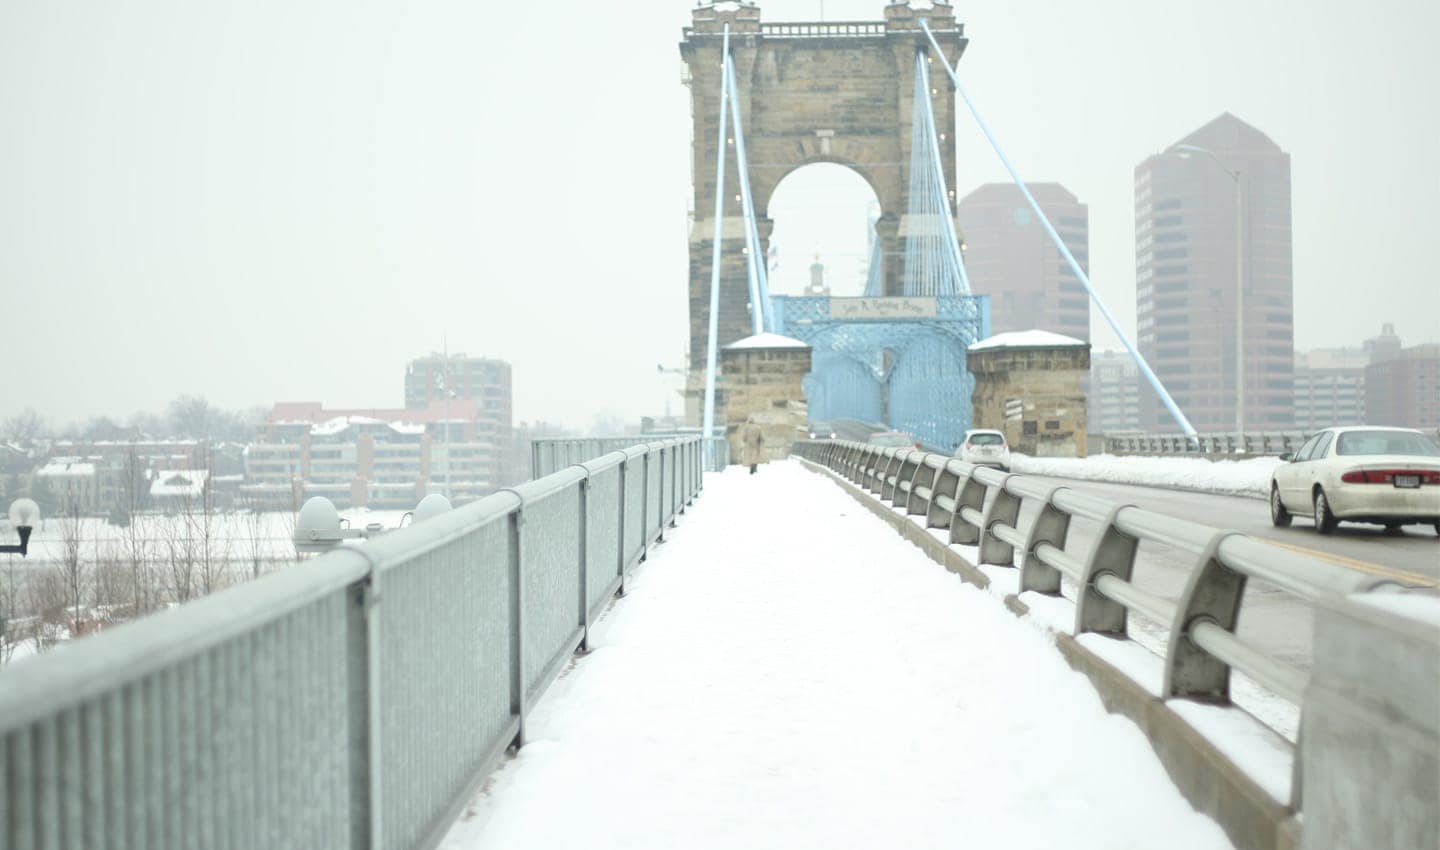
Cincinnati hit by bad snow at the start of the year saw its traffic congestion increase dramatically as road networks became difficult to traverse.
February 2021 saw the highest levels of hourly congestion, a result of snowfall and adverse weather conditions. TomTom says 25% of the world’s cities experienced their worst levels of hourly congestion during the second month of the year.
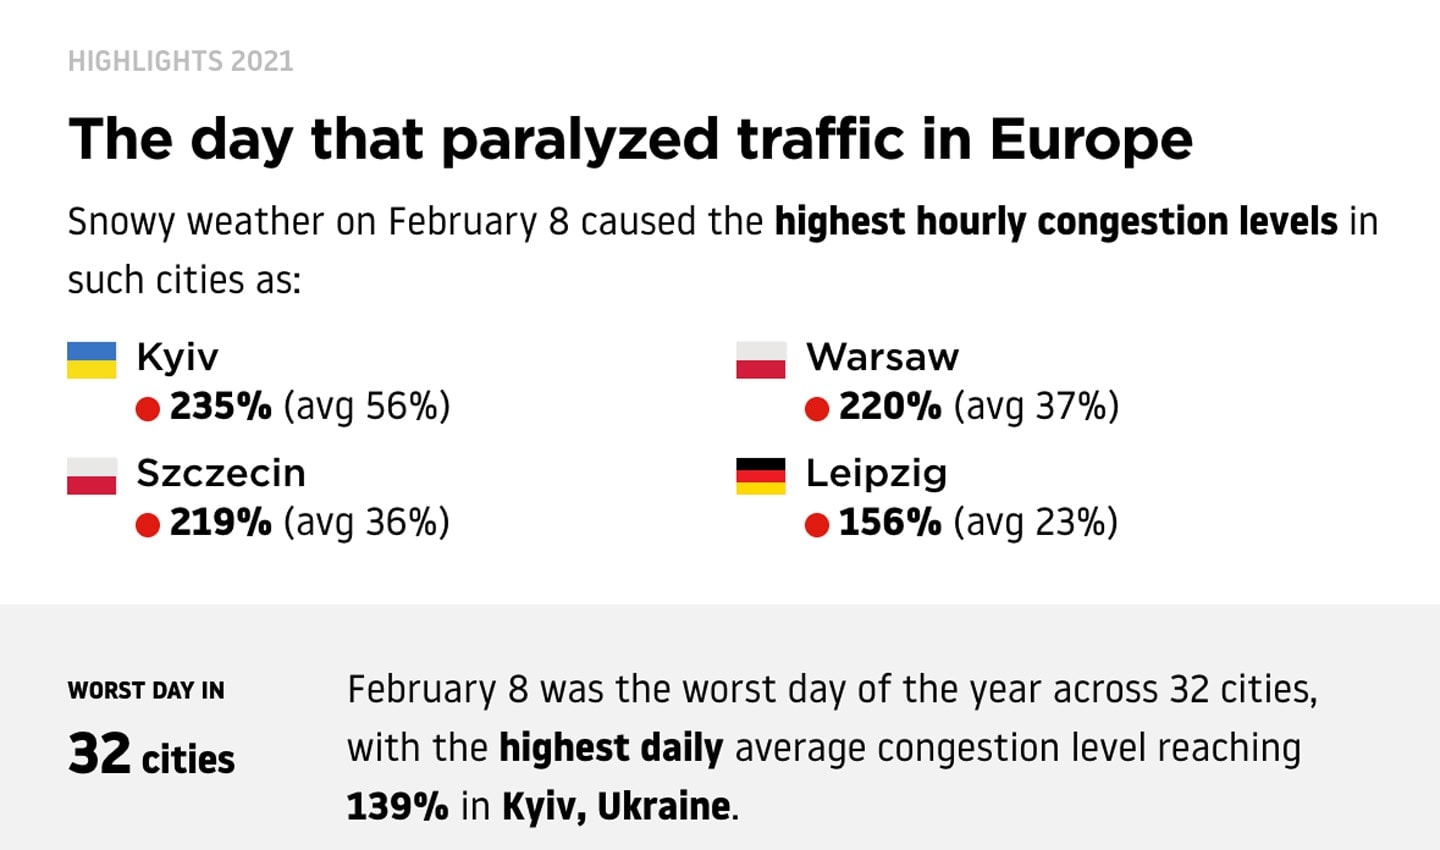
Kyiv, Ukraine, was one of the worst hit by bad weather. On February 8, its congestion level rose to 235%. In Warsaw, Poland, on the same day, congestion increased to 220%. Cincinnati, USA, a city better known for its Greek inspired chili dish, can now also be known for how terrible its traffic was during the bad weather of early 2021. TomTom says its hourly congestion level hit 241% at one point in February during a period of heavy snow.
What’s the story?
To briefly summarize, there are a few key things that we learn from this year’s Traffic Index:
1. Traffic and congestion is, on the whole, still down from pre-pandemic levels.
2. Compared to 2020, traffic is showing signs of recovery.
3. Weather might be to blame for some of the year’s most congested days.
4. When coronavirus lockdowns lift, people hit the road as soon as they can.
What do the numbers mean?
While changes in the percentage of congestion give us insight into the world’s worst offending cities for traffic, it requires a little more context to understand what these numbers mean on their own, so here’s the background.
TomTom uses a rather simple formula that allows them to demonstrate the level of congestion in a given city. For example, a 53% congestion level in Berlin, Germany, means that a 30-minute trip will take 53% more time than it would during the city’s baseline uncongested state.
You can turn this 53% into travel time through simple calculations. First: 0.53 x 30 mins = 15.9 mins extra average travel time. Second: 30 mins + 15.9 mins = 45.9 mins total average travel time.
If you want to learn more and dive into the data to see how your home city fared over the past year, check out TomTom Traffic Index here.
People also read
)
Do low emission zones work? TomTom Traffic Index has the answer
)
See the true environmental cost of inner-city congestion with TomTom Traffic Index
)
The changing shape of inner-city traffic: How COVID-19 changed the way we move in 2021
* Required field. By submitting your contact details to TomTom, you agree that we can contact you about marketing offers, newsletters, or to invite you to webinars and events. We could further personalize the content that you receive via cookies. You can unsubscribe at any time by the link included in our emails. Review our privacy policy. You can also browse our newsletter archive here.