)
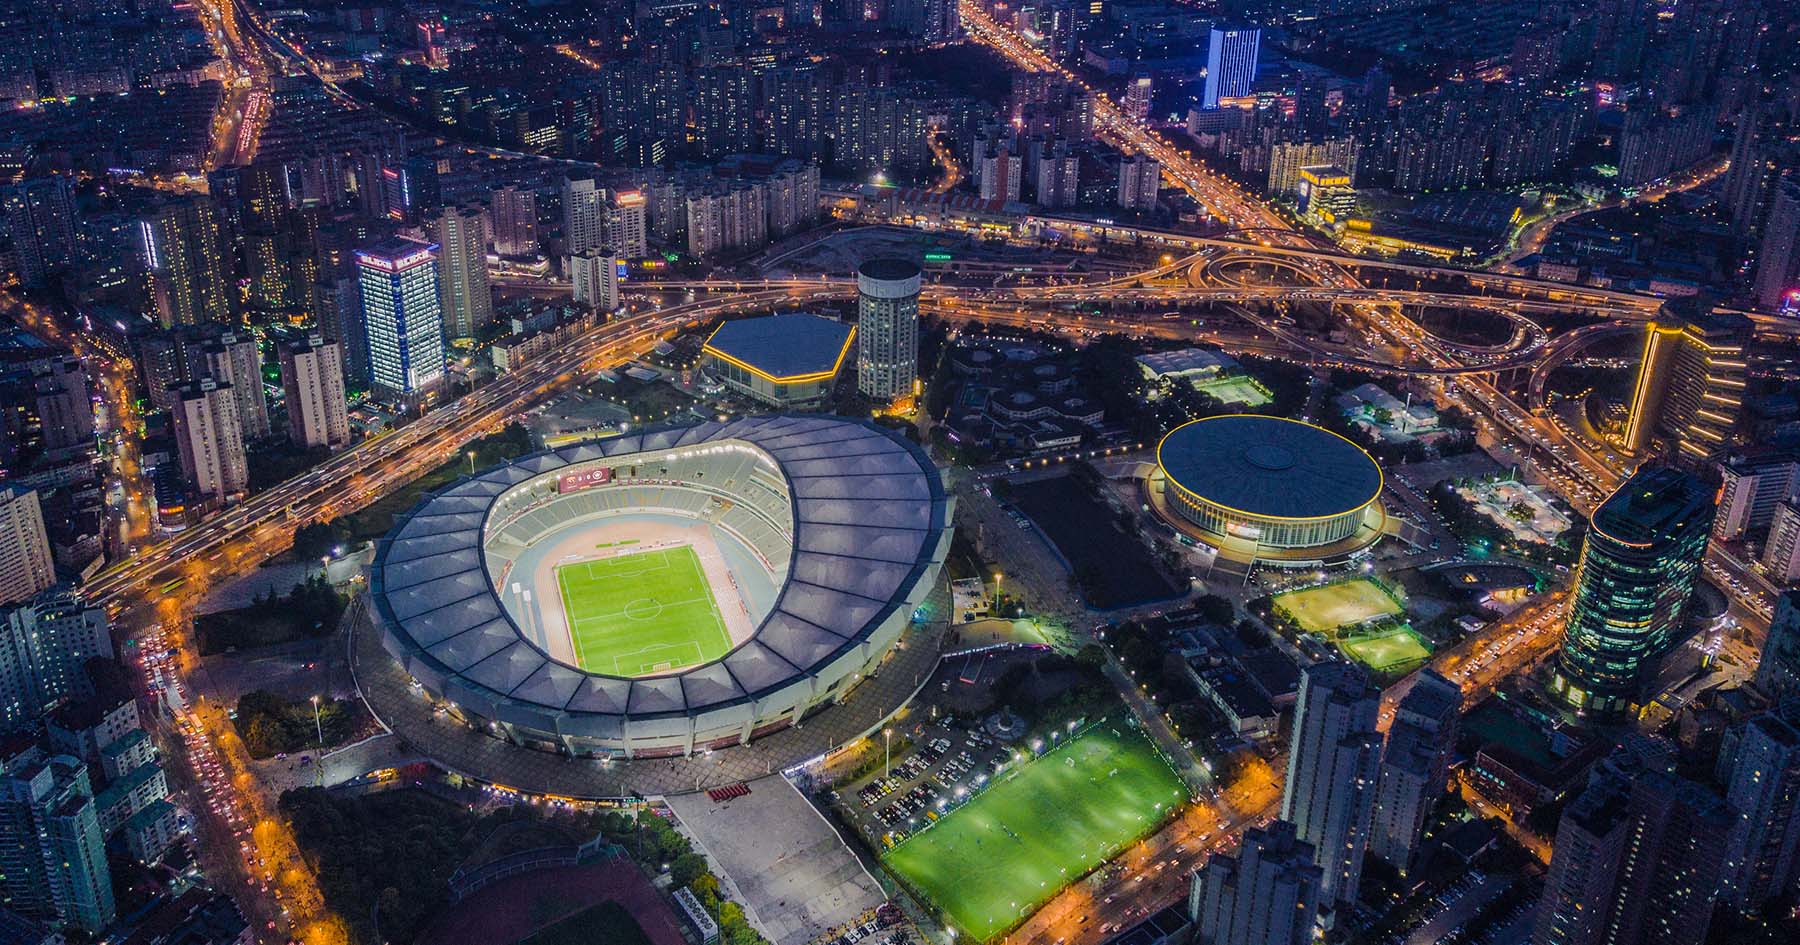
Hosting big events like a soccer world cup or a major music festival is a huge undertaking for any city or state. Thousands arrive, moving between airports, hotels, stadiums and tourist hotspots — changing the typical traffic patterns. Fans, VIPs, officials, and emergency services all have different priorities and need to move between different locations, while making sure residents’ daily lives aren’t disrupted.
Without data-driven planning, even cities with strong infrastructure can grind to a halt. And how an event is managed can define whether the city is remembered for sporting excellence or logistical failure.
Planning for the surge
The biggest mistake cities can make is planning event mobility based on typical traffic. Events create unique congestion spikes that don’t resemble normal rush hours. Fans travel in hordes and follow unfamiliar routes. VIPs and officials need to move between hotels and venues safely and arrive at set times. Emergency services need to get to incidents as soon as possible, without disrupting the flow of regular traffic.
Modern traffic analytics allow planners to model these changes in advance and track hundreds of critical routes simultaneously. By understanding where visitors are likely to come from, which corridors are most vulnerable to congestion and when the pressure will peak, cities can proactively adjust traffic flows, implement measures like retiming signals and ensure public transport shoulders part of the load. The lesson is clear: the right traffic intelligence gives authorities a comprehensive view of conditions throughout the road network, allowing them to control what happens.
Managing demand by categorizing it
One of the most effective strategies is separating traffic demand by user type. Fans and teams should not compete for the same road space. In-depth traffic analytics make this possible by revealing how different groups move. For example, understanding fan travel patterns helps planners identify the best locations for park-and-ride hubs or drop-off zones. Meanwhile, monitoring team and VIP corridors separately can ensure secure and predictable journeys and the smooth running of the event.
This approach proved crucial during the 2022 football World Cup in Qatar, where many stadiums were newly built and hadn’t been mapped yet. With limited historical data, real-time insights became indispensable. Traffic corridors between airports, hotels, and venues were monitored continuously, allowing authorities to react instantly to incidents or slowdowns, avoiding delays.
Learnings from London and Paris
London's 2012 Olympics remain a masterclass in long-term transport legacy, demonstrating how large events can have a positive impact on host cities. Over £6.5 billion was invested in rail, bus and station upgrades, many of which are still in use today. Advanced traffic modeling introduced for the Games continues to support daily operations over a decade later.
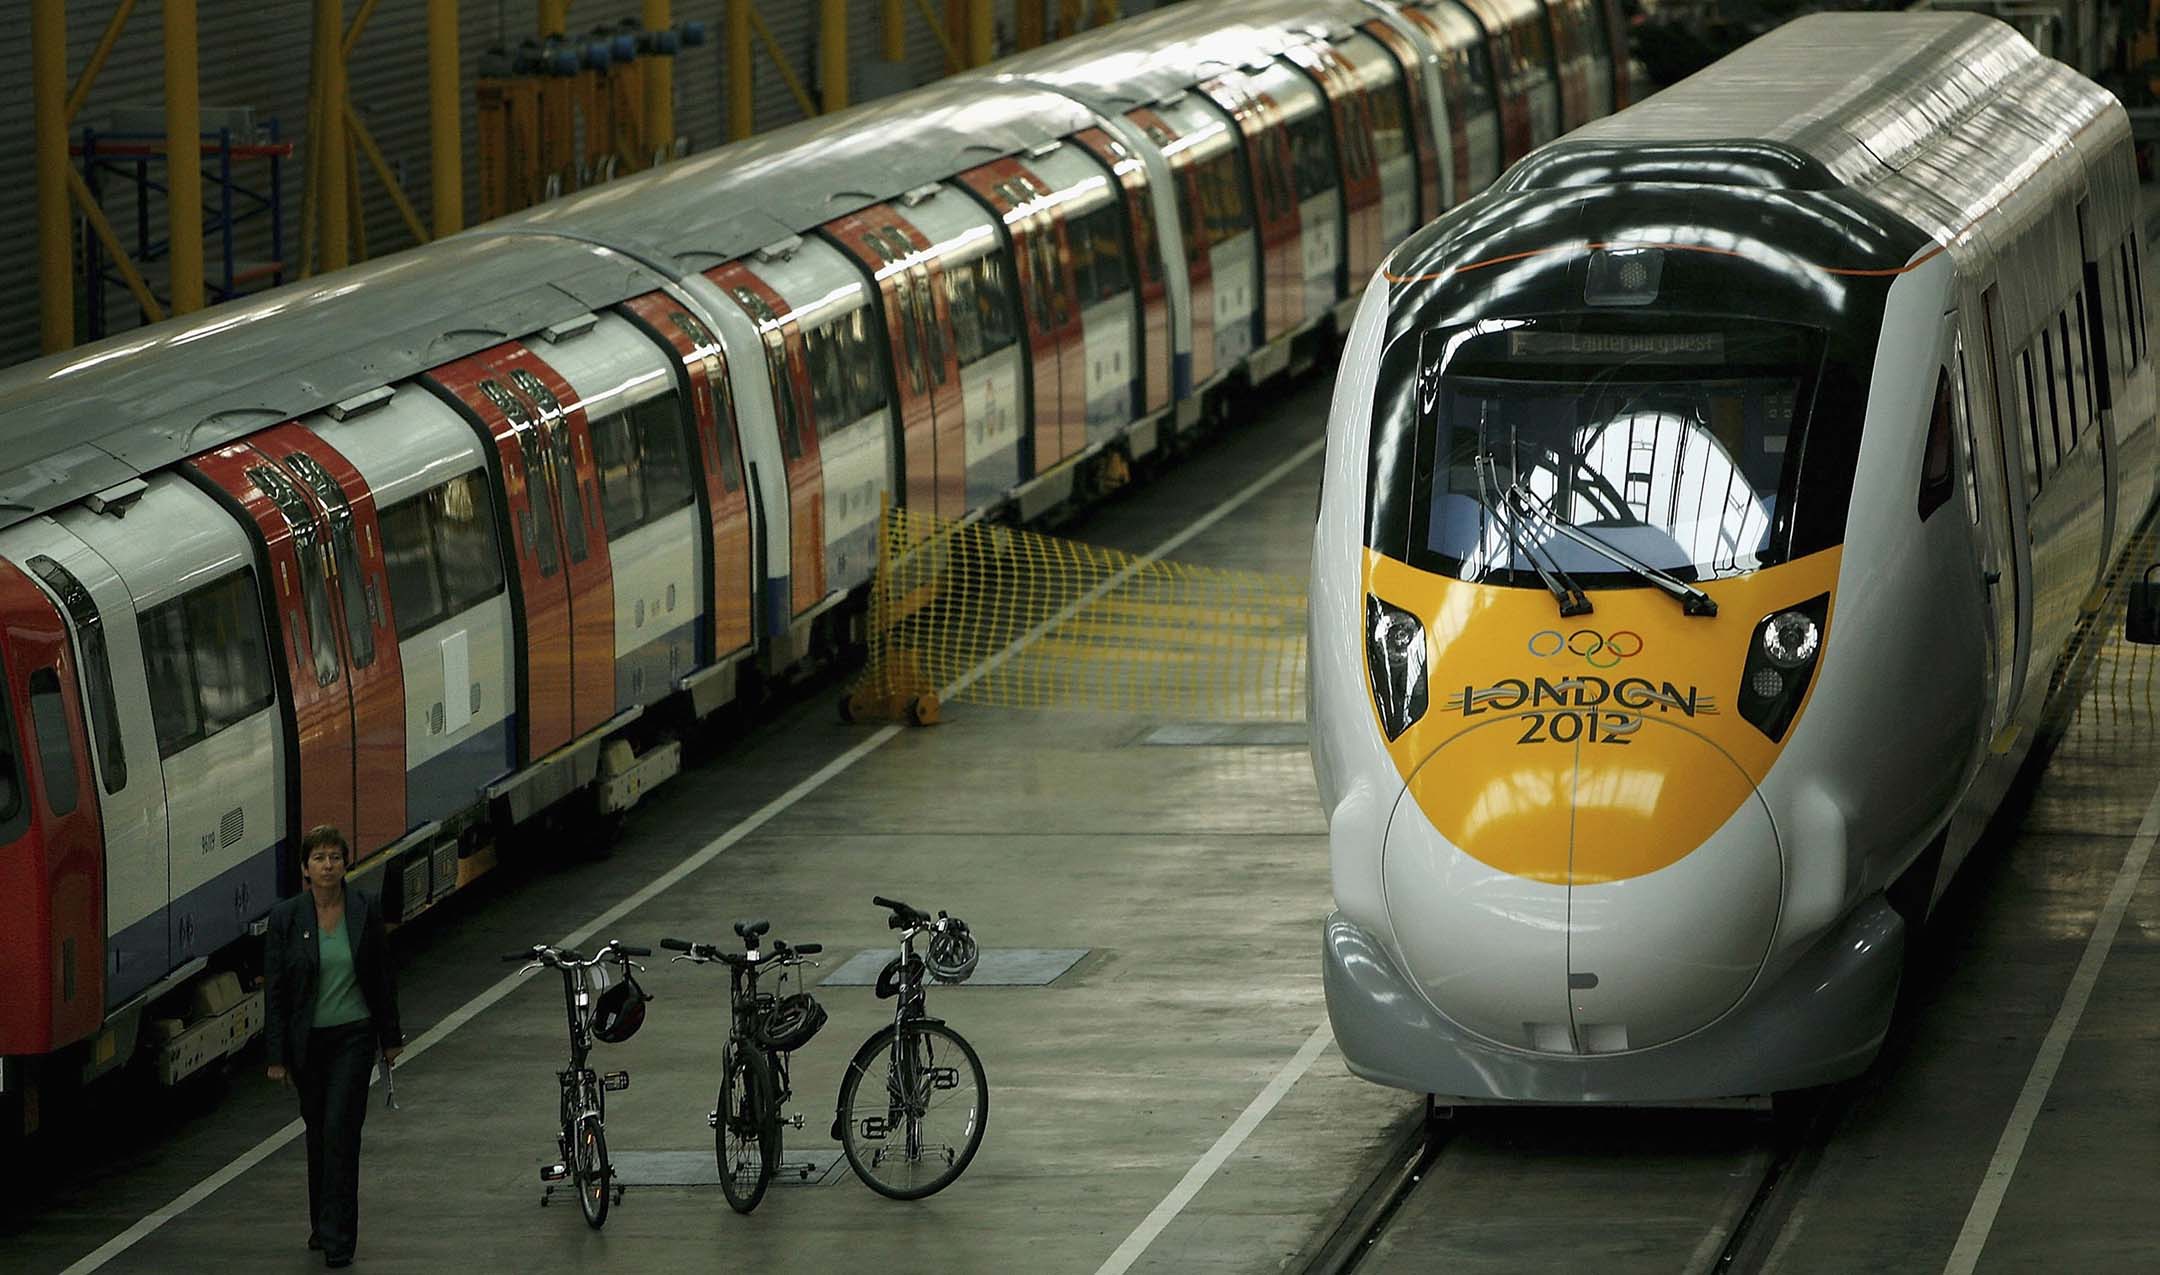
London also illustrates the importance of managing demand. Reserving lanes for athletes and officials, while important, created friction for everyday commuters. The city responded with clear communication, encouraging residents to shift travel times, use public transport, or avoid non-essential trips.
For the 2024 Olympics, Paris took a more structural approach. Authorities used the event to kickstart the transition to a greener, people-first city. For the first time in Olympic history, all venues were accessible by public transport. New bike routes — the “Olympilanes” — were designed not as temporary fixes, but as permanent improvements to urban mobility. And the plan seemed to work. Even during the coveted closing ceremony, the roads around the Stade de France, albeit congested, always kept moving. 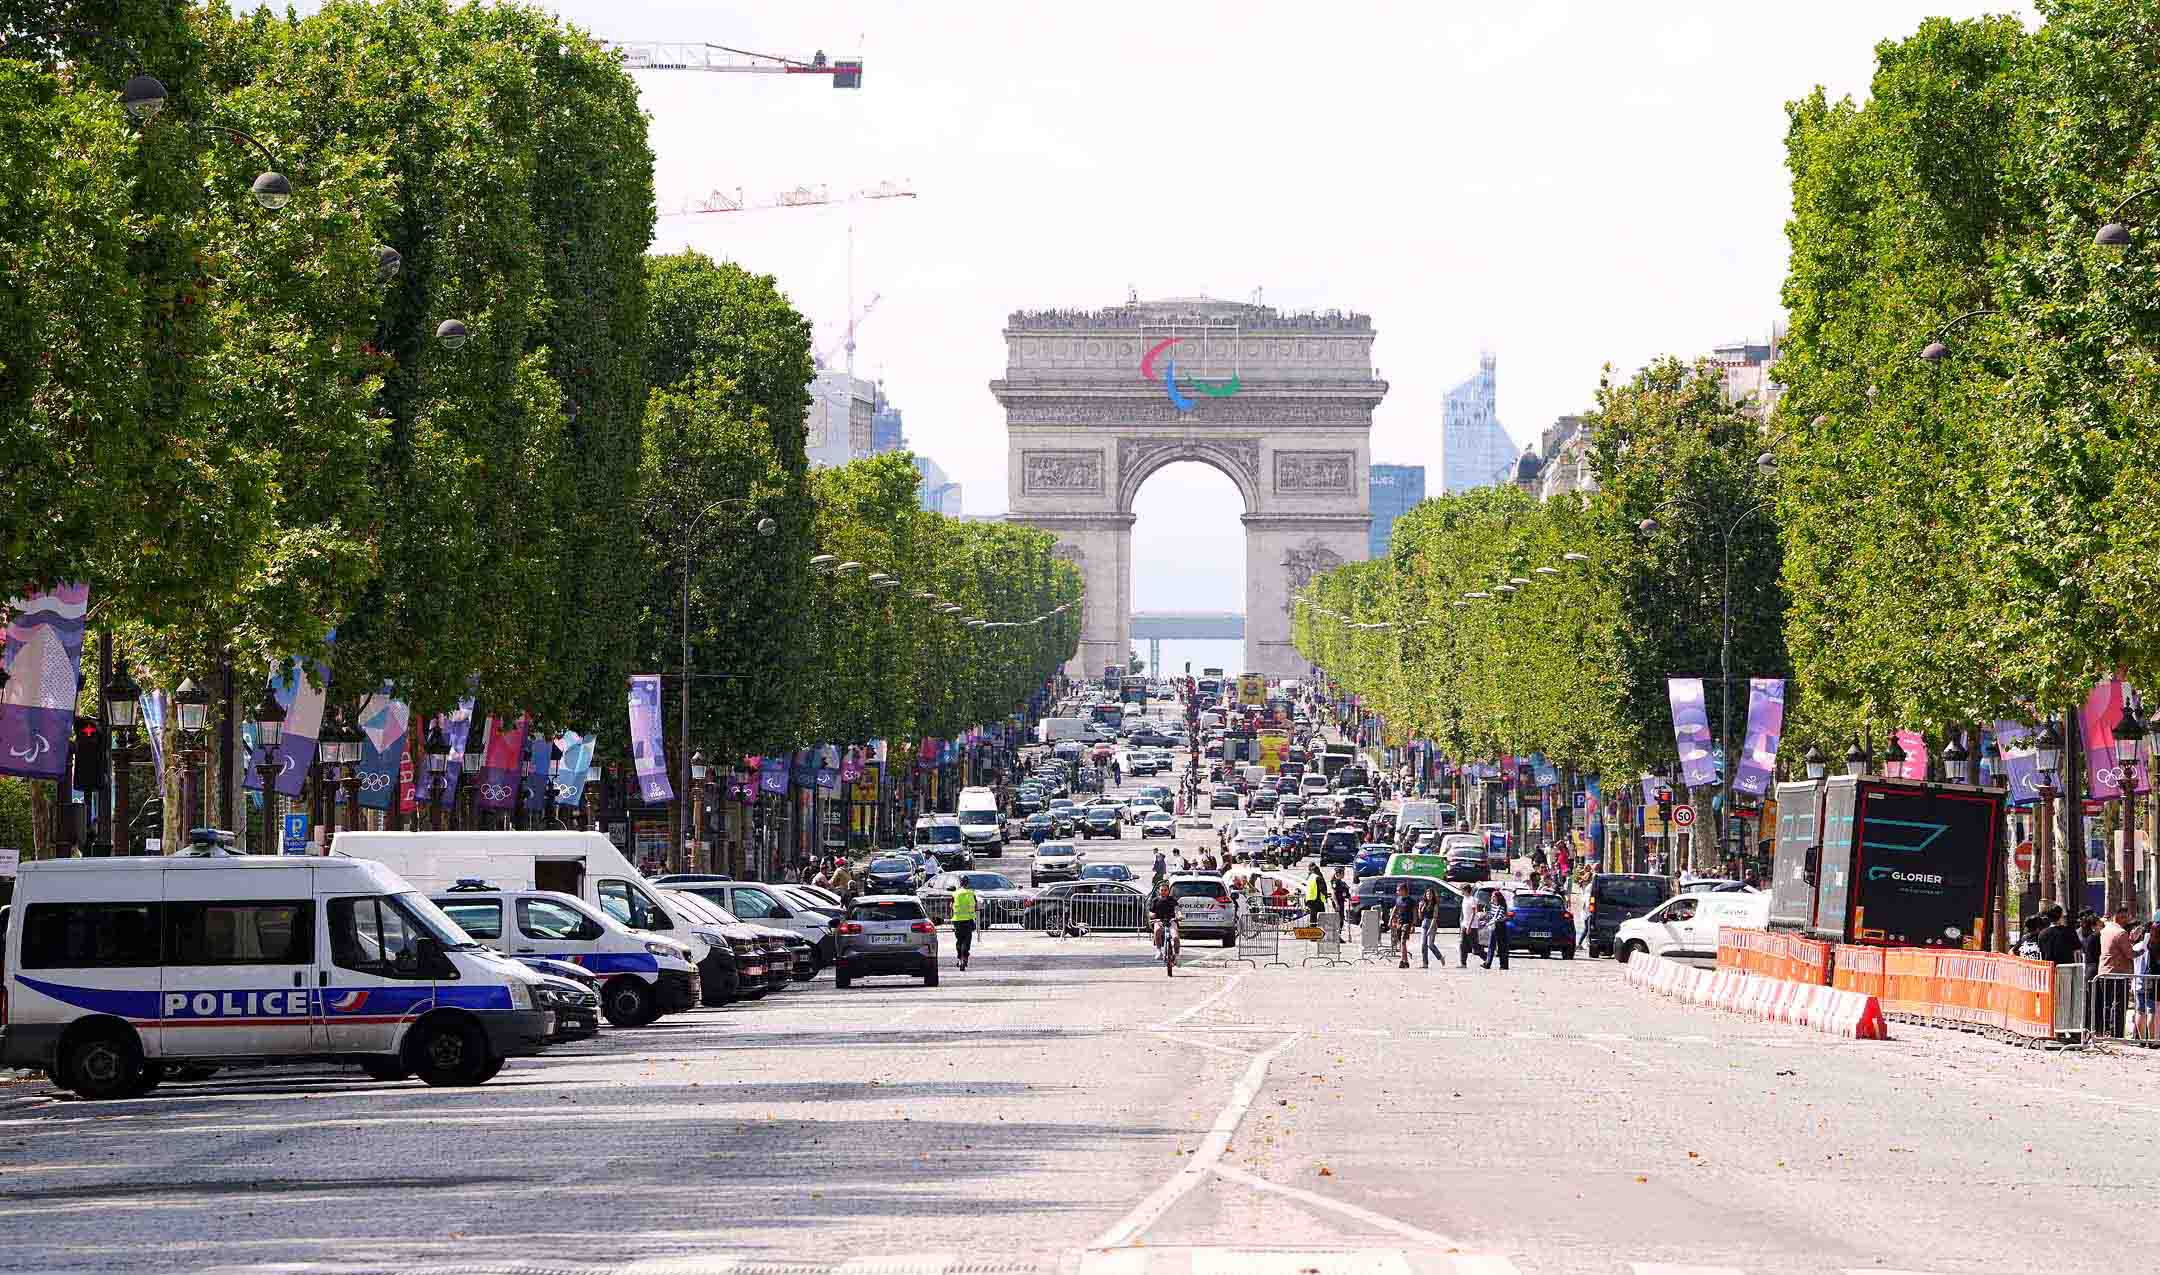
These movements were captured in a special Paris edition of the TomTom Traffic Index, which was released in collaboration with the French Ministry of Transport and Paris traffic authorities to give Parisians and Olympic spectators insights on congestion levels and live travel times. The company has released a similar edition for the 2026 football world championship, so authorities, locals and fans can know exactly where the traffic hotspots are, which routes are clear and what roads have been unexpectedly closed.
Real-time adjustments on event day
No matter how good the plan is, conditions are bound to change on the day. Real-time route monitoring allows traffic control centers to spot falling speeds, emerging bottlenecks, or unusual delays as they happen. Junction-level analytics reveal exactly where delays are forming and how vehicles are moving through intersections, enabling quick adjustments such as retiming traffic lights or rerouting flows.
When conditions change fast, timely communication is equally important. By predicting congestion and sharing update insight via apps, social media, radio or roadside signage, cities can help travelers adapt. Even a fraction of commuters choosing not to drive can prevent gridlock.
A lasting legacy
Hosting a mega sporting event is a stress test for any city. But with the right data, tools, and collaboration, it can also be a catalyst for long-term improvement. Investing in traffic analytics helps cities not just survive big events but also learn from them. Armed with the right traffic intelligence, cities emerge smarter, more resilient and better prepared for future growth. And for planners and citizens, that win could mean more than any other.
People also read
)
The Olympic impact: Transforming host cities for good
)
How mapmakers keep chaotic traffic under control during a total solar eclipse
)
THTC and TomTom transform traffic management in the Middle East
)
Tackling traffic around football's biggest tournament
* Required field. By submitting your contact details to TomTom, you agree that we can contact you about marketing offers, newsletters, or to invite you to webinars and events. We could further personalize the content that you receive via cookies. You can unsubscribe at any time by the link included in our emails. Review our privacy policy. You can also browse our newsletter archive here.