Traffic Index
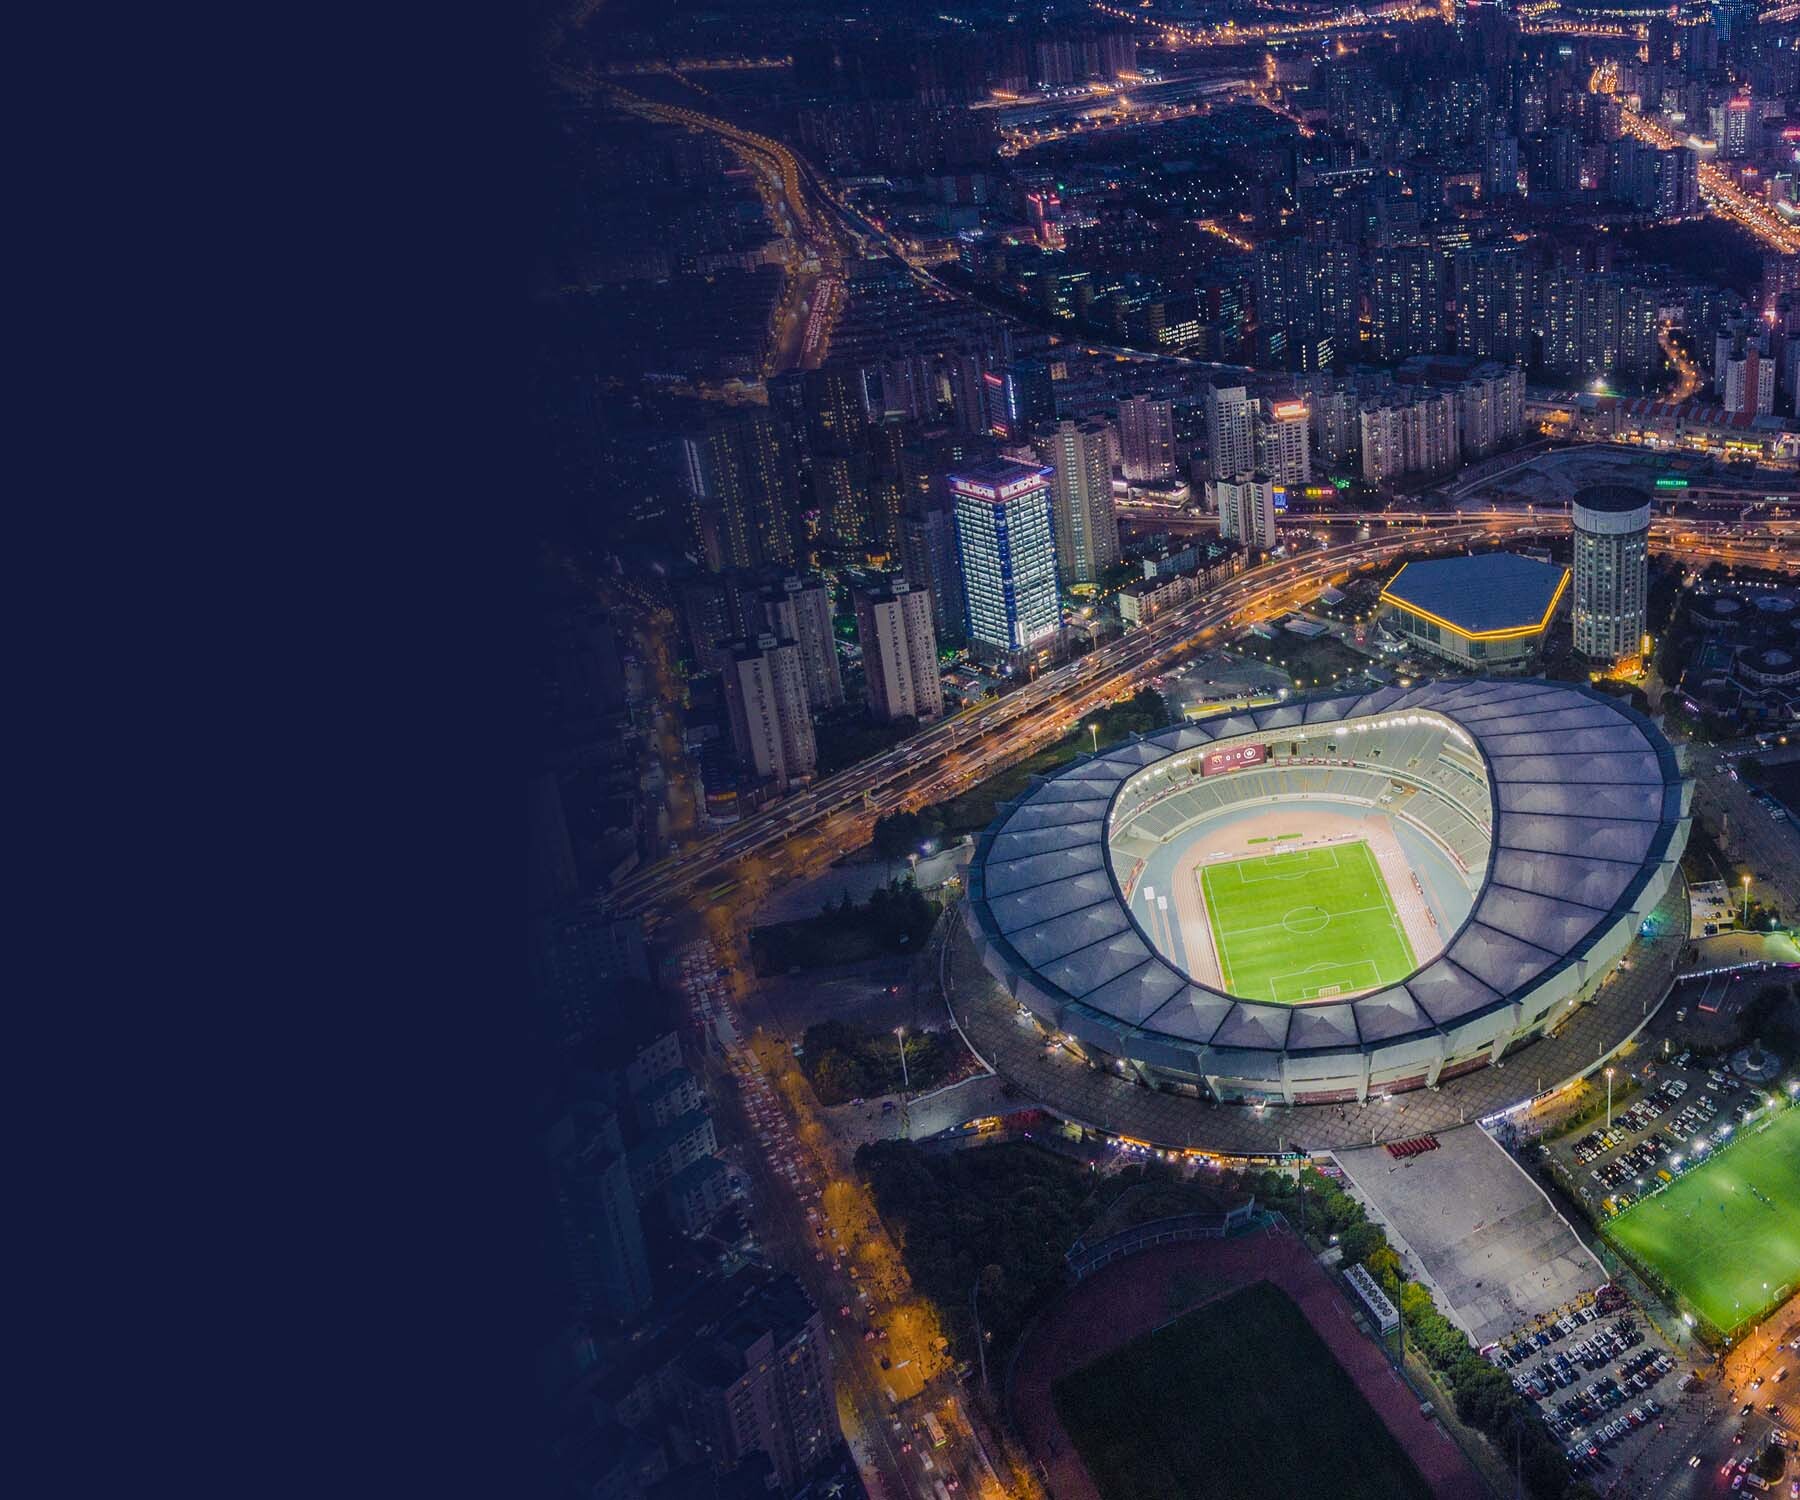
Football world championship 2026
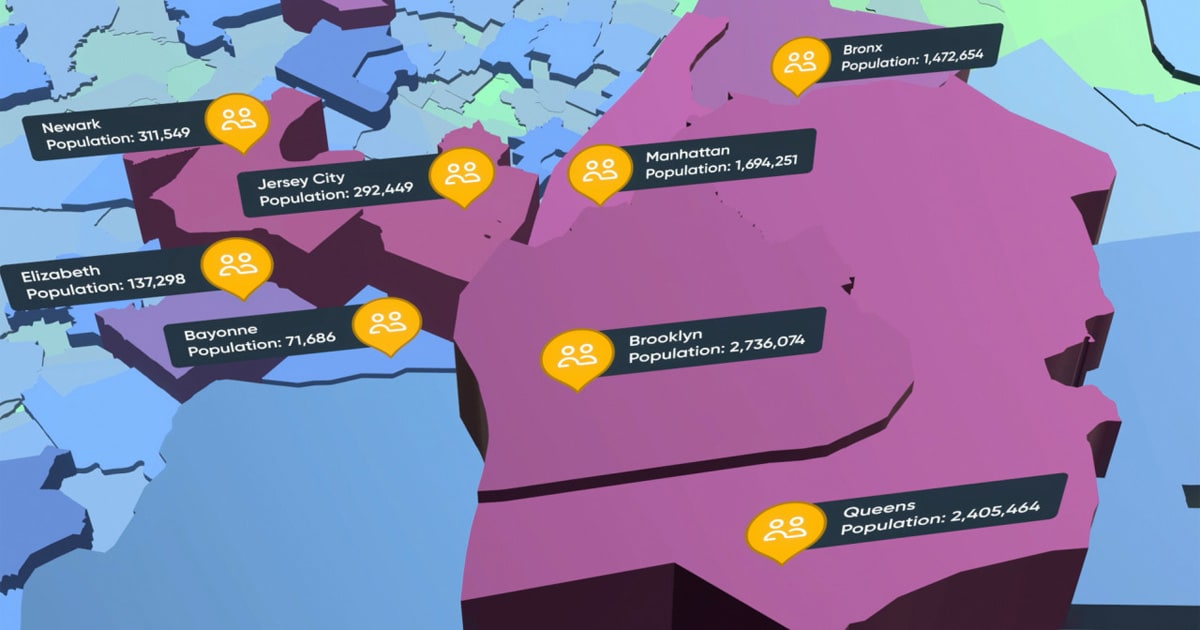
With major tournaments come major city mobility challenges. Dive into live and historical data for play-by-play traffic patterns and insights as matches take place across 16 stadiums in Canada, the USA and Mexico, and see which cities best tackle congestion and which take drivers into extra time.
MetLife Stadium, New York/New Jersey
Live trafficLast update
—
Local time
—
MetLife StadiumLive traffic
Congestion level
—
—
Distance driven in 15 min
—
Traffic jams
—
Total count
—
Total length
Speed
—
—
Congestion level
—
—
Speed
—
—
Distance driven in 15 min
—
Traffic jams
—
Total count
—
Total length
Last update—
Local time—
Hourly speed and congestion level
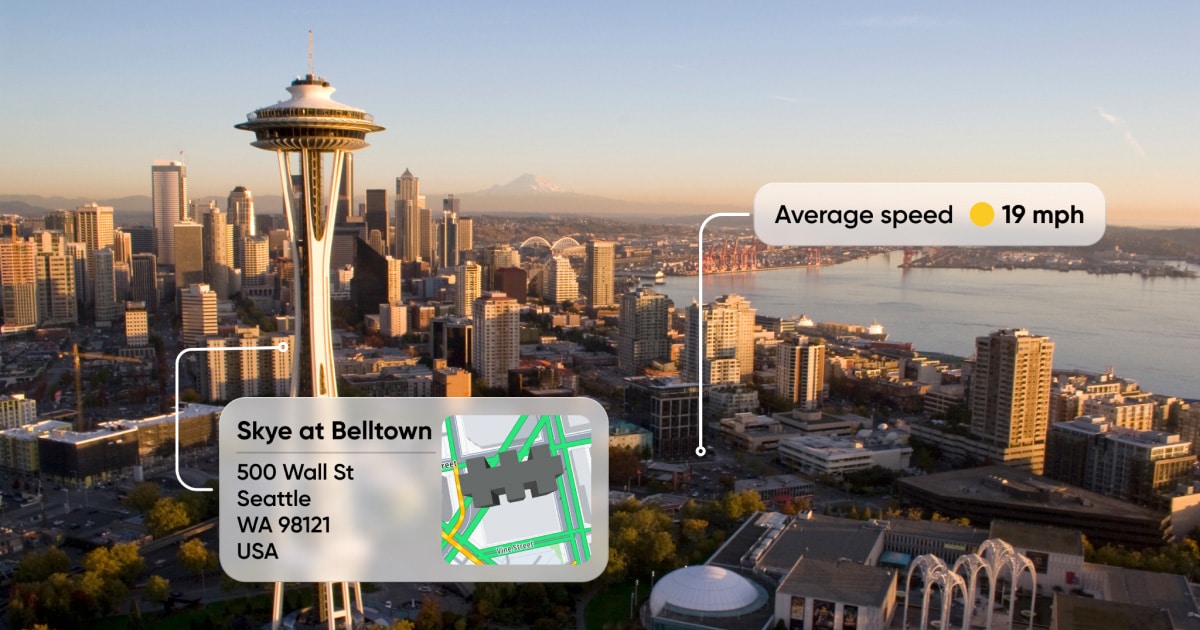
Live traffic intelligence
Uncovering valuable mobility insights is as simple as asking the right question. Explore the interactive tool below for a snapshot of how AI helps you analyze live conditions, pinpoint optimal and incident-prone routes — plus more — across different sectors and use cases.
MetLife Stadium, NJ
Predictions for the final
The 2026 tournament final will take place at the MetLife Stadium, NJ, on July 19. This stadium sold out for the football club championship final in July, 2025. And just like the upcoming final, this match took place at 3pm EDT on Sunday. Comparing road conditions during the 2025 final with typical traffic reveals potential chokepoints, travel times and other insights into how game day might affect city traffic.
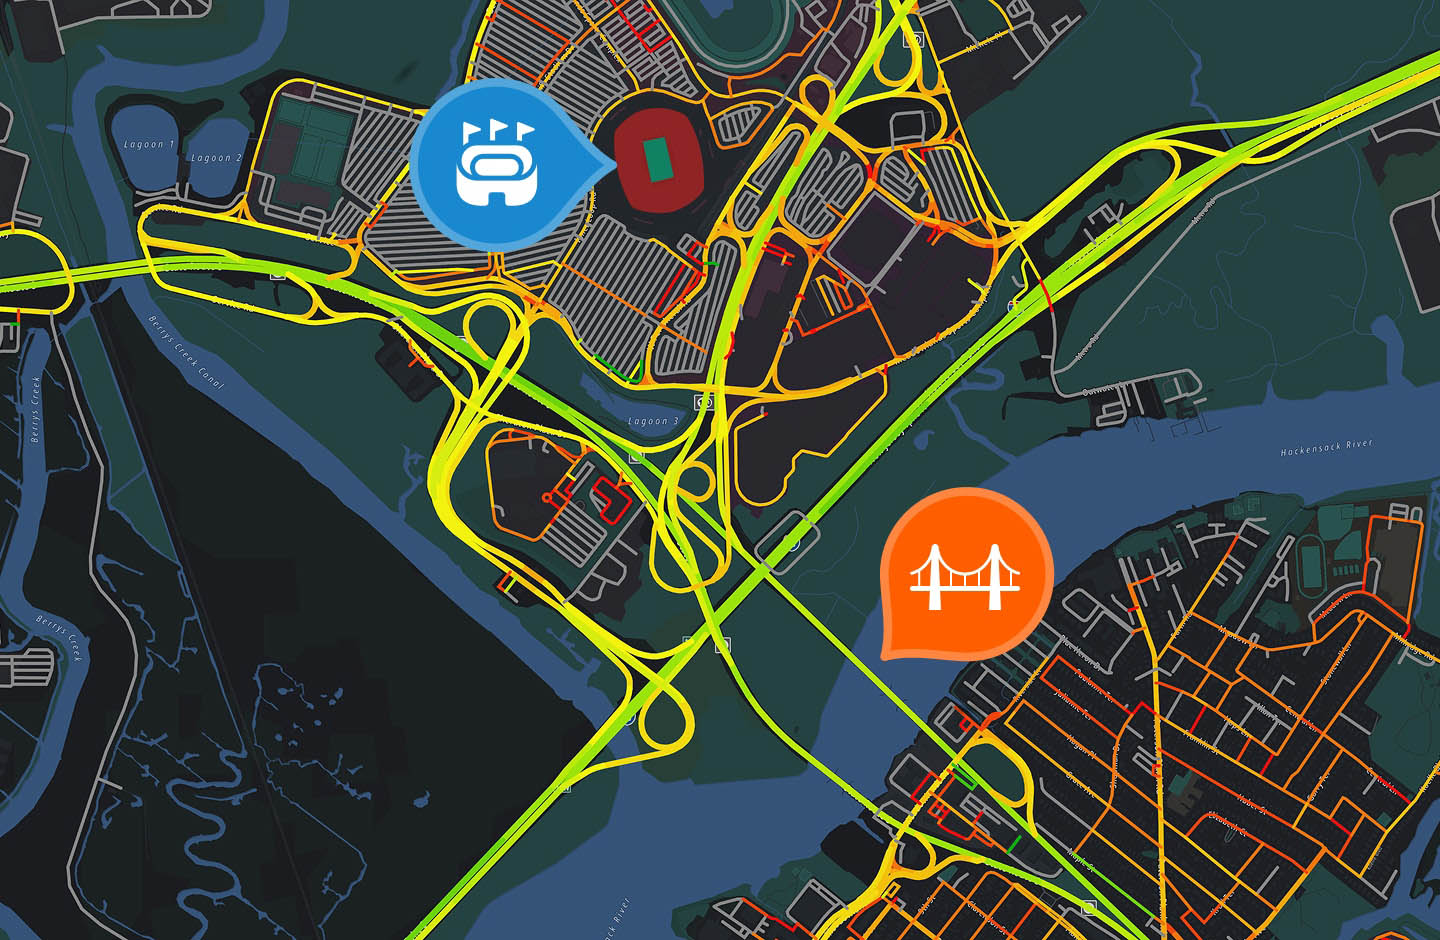
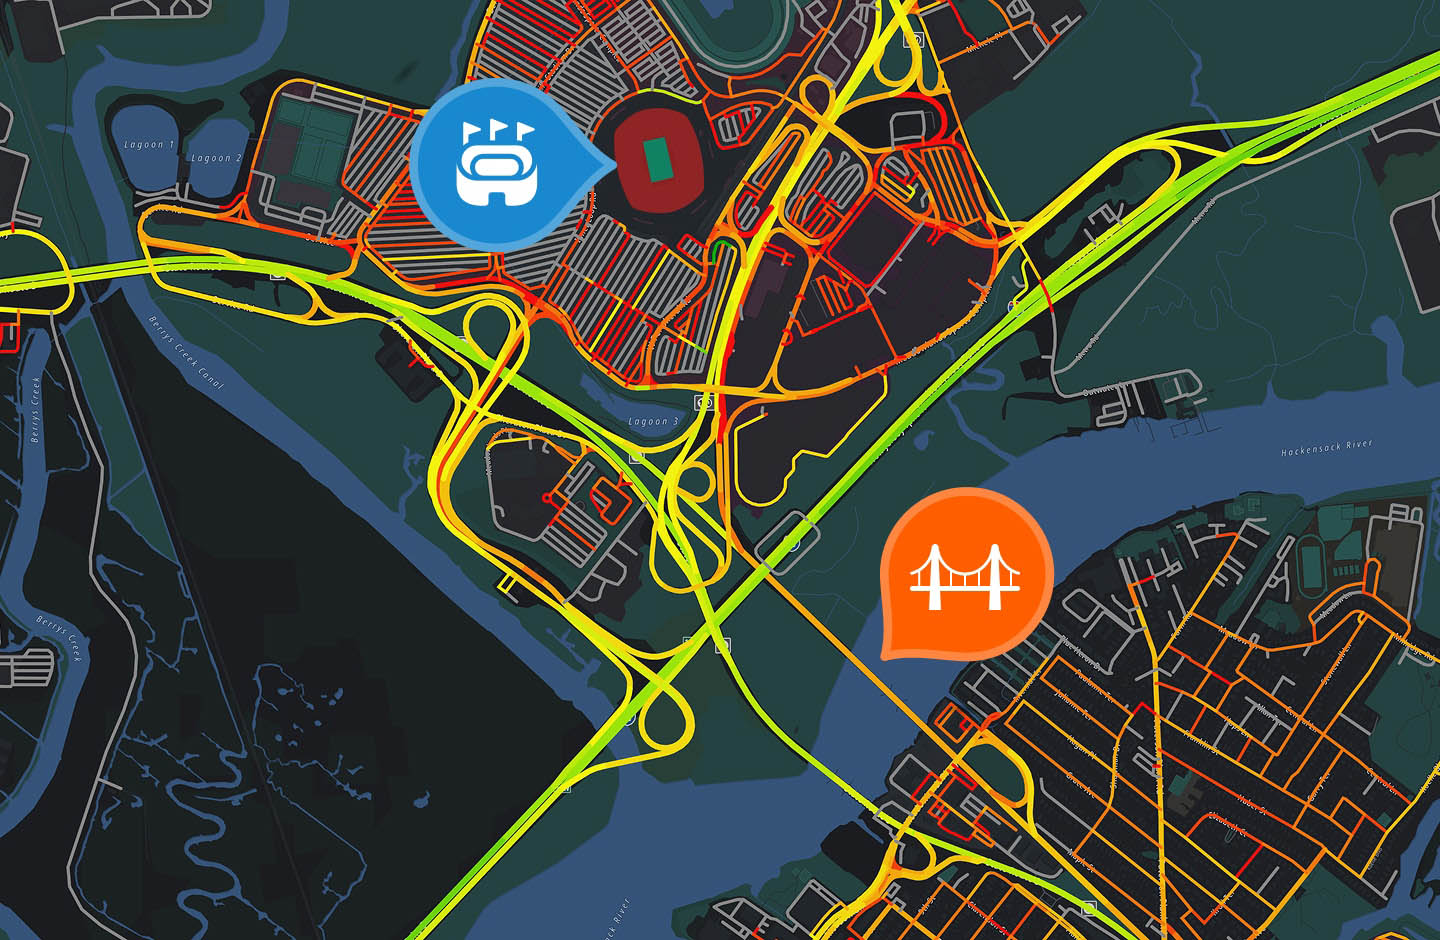
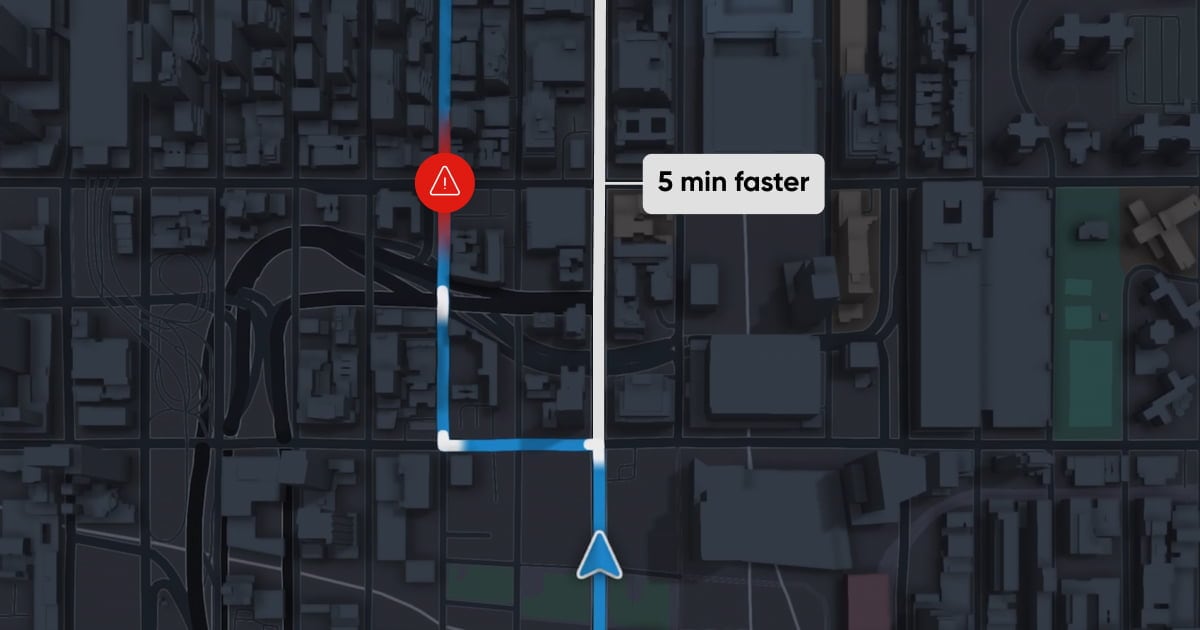
Are bridges bad bottlenecks?
Traffic and mobility intelligence provides authorities with critical insights. On a typical day, congestion sits at 9.1% at 2pm, and it would take drivers an average of 2 minutes and 36 seconds to drive 3 km. Around 2pm on gameday last year, congestion soared to 195.6%, nearly tripling this travel time to 7 minutes and 47 seconds.
With all of New York to the east, the NJ-3 bridge westbound over the Hackensack River represents a significant bottleneck. Monitoring this traffic corridor will be crucial to ensure that critical safety services, such as emergency responders, can cross without significant delay.
-
Solution
Government and public sector
Enhance citizen safety and support sustainable urban growth.
Learn more →
-
Solution
Insurtech
Improve risk modeling and build competitive policies
Learn more →
-

Solution
Defence and intelligence
TomTom’s defence tech is designed to deliver precise situational awareness in real time.
Learn more →
-
Product
Traffic APIs
Real-time and historical traffic analysis, including incident reporting and live road speed data.
Learn more →
Football world championship 2026 white paper
Urban mobility becomes highly disrupted during major events like the football world championship, and TomTom uses long-term traffic data to analyse and provide insights into these evolving congestion patterns.

-

Managing mobility at mega events: Lessons from major football tournaments and more
Learn how agencies and ecosystem partners use mobility data to prioritize safety and efficiency during large-scale events.
Register for webinar →
-
How traffic intelligence supports cities in hosting major sporting events
Learning how fans, VIPs, officials, and emergency services move between different locations, while making sure residents’ daily lives aren’t disrupted.
Read more →


Let’s change the way the world moves!
Decision-shaping data for traffic engineers, policy leaders and transport planners.
-

Get in touch
We help your cities, cars or policies tackle traffic better. Leave your details and we’ll get in touch.
Contact us →
-

Make your own reports in seconds
Use our web portal to access reports with ready-to-use data visualizations and download the results for your own custom analysis.
Get 30 days free →

