)

Insurance is a business built on risk, probability and trust. From underwriting policies to validating claims, auto and property insurers rely on accurate information to assess risk exposure and make fair decisions. Yet in an increasingly connected and fast-moving world, traditional data sources alone are no longer enough. As insurers face growing pressure to reduce fraud, improve operational efficiency and deliver more personalized pricing, the industry is turning to richer, real-time data sources to gain deeper insight into risk.
Imagine a global insurance company that handles auto insurance. A driver reports a collision on a busy road during evening peak hour. The claim comes in. According to their statement, congestion built up quickly, visibility was limited and braking distance was compromised. On the surface this seems like a familiar and plausible scenario — one that fits patterns insurers have seen many times before. But the insurance industry knows from experience, familiarity does not equal accuracy.
What matters isn’t whether a claim sounds plausible. What matters is whether it reflects what actually happened. For years, insurers built models and algorithms to process claims faster. Automation reduced manual labor and improved efficiency allowing organizations to scale, but fair claims decisions still miss a crucial element — understanding the real-world context. Without this validated context, it’s often one person’s word against another and what was documented. But such sources probably show only one-sided view and can’t be fully trusted.
Validation with traditional sources
Traditionally, auto insurers validate claims using police reports, witness statements, claimant interviews, repair estimates, telematics data (plugged in devices to monitor driving behavior), and if available, traffic camera footage. While telematics data and traffic cameras can provide objective evidence of vehicle movements and accident circumstances, this data isn’t always available. Traffic camera footage is often restricted, controlled by municipalities, transportation agencies, or law enforcement and requires formal requests and the navigation of retention and privacy policies. Gathering all of this can take weeks, if not months.Beyond infrastructure, insurers also need to deal with fragmented data sources, inconsistent information and resource-intensive retrieval and analysis processes, making validation difficult to scale across large geographies. As per a report from Accenture, 95% of underwriters reference improved data quality and analytics as a key contributor to better underwriting and risk management.
Less guesswork, more accuracy with data
Many insurers are surprised to find that the most transformative sources and ways to validate information comes from geospatial and traffic data. Many suspect it’s useful but haven’t applied it in practice or have failed to operationalize it. But, by combining location intelligence with historical and live mobility patterns, insurers can move beyond static assumptions and toward a more dynamic understanding of how, where and why incidents occur. And more importantly, what claimants say is actually true.
Whether validating the circumstances of a collision, reconstructing driver behavior or refining premium calculations based on actual road usage, location intelligence tech is reshaping the way insurers evaluate risk and claims. The result is a new generation of insurance models that are more precise, transparent and responsive to real-world conditions. Mapping the world, everything that happens on the road networks, as well as mapping the constant changes that happen on these networks has been the task of the ages for mapmakers like TomTom. With Orbis maps and its world-leading traffic data, TomTom is one of the few geolocation organizations that can provide a detailed and insightful look into the happenings on a specific road segment at a specific time and help with claims validation effectively.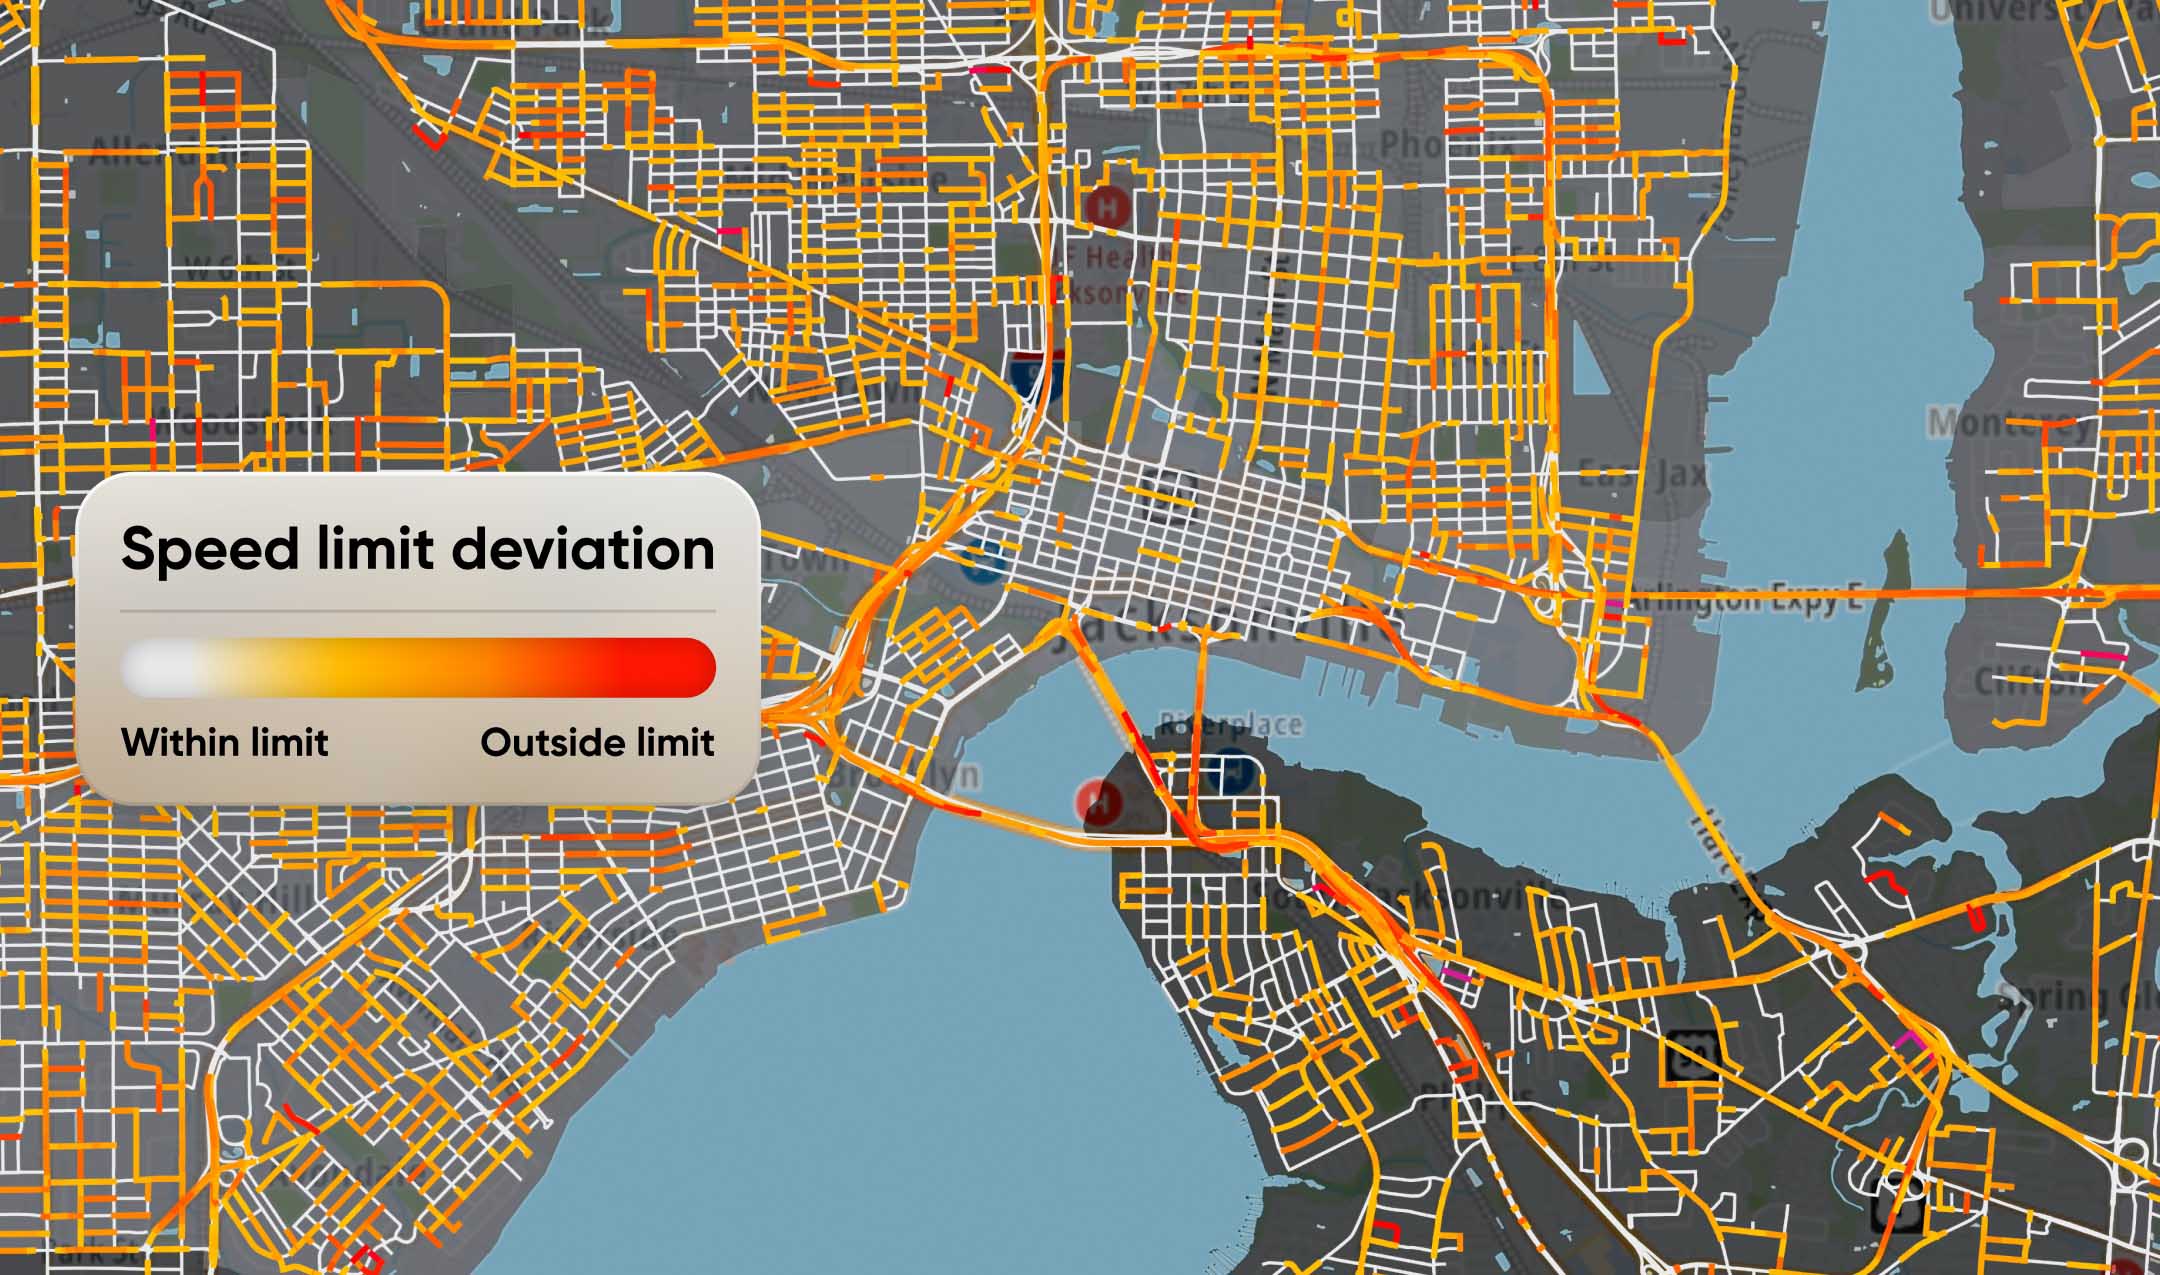 Real-time location intelligence and decades of historic traffic data are transforming how insurers write policies or manage claims. The industry is realizing the potential of geospatial and traffic analytics data. As our product marketing lead explains:
“Vinod Poomalai,
Product marketing, TomTom
The applications of traffic, maps and geospatial data
Territory risk assessment
Insurance companies have long used historical claims data and broad geographic regions to estimate risk. But not all roads, neighborhoods, or driving environments are the same. Within one zip code area streets can have very different levels of congestion, speeding or accident likelihood. TomTom’s geospatial maps and traffic data allow insurers to correctly build risk scores for territories, zip codes or road segments to better represent risk based on real-world conditions.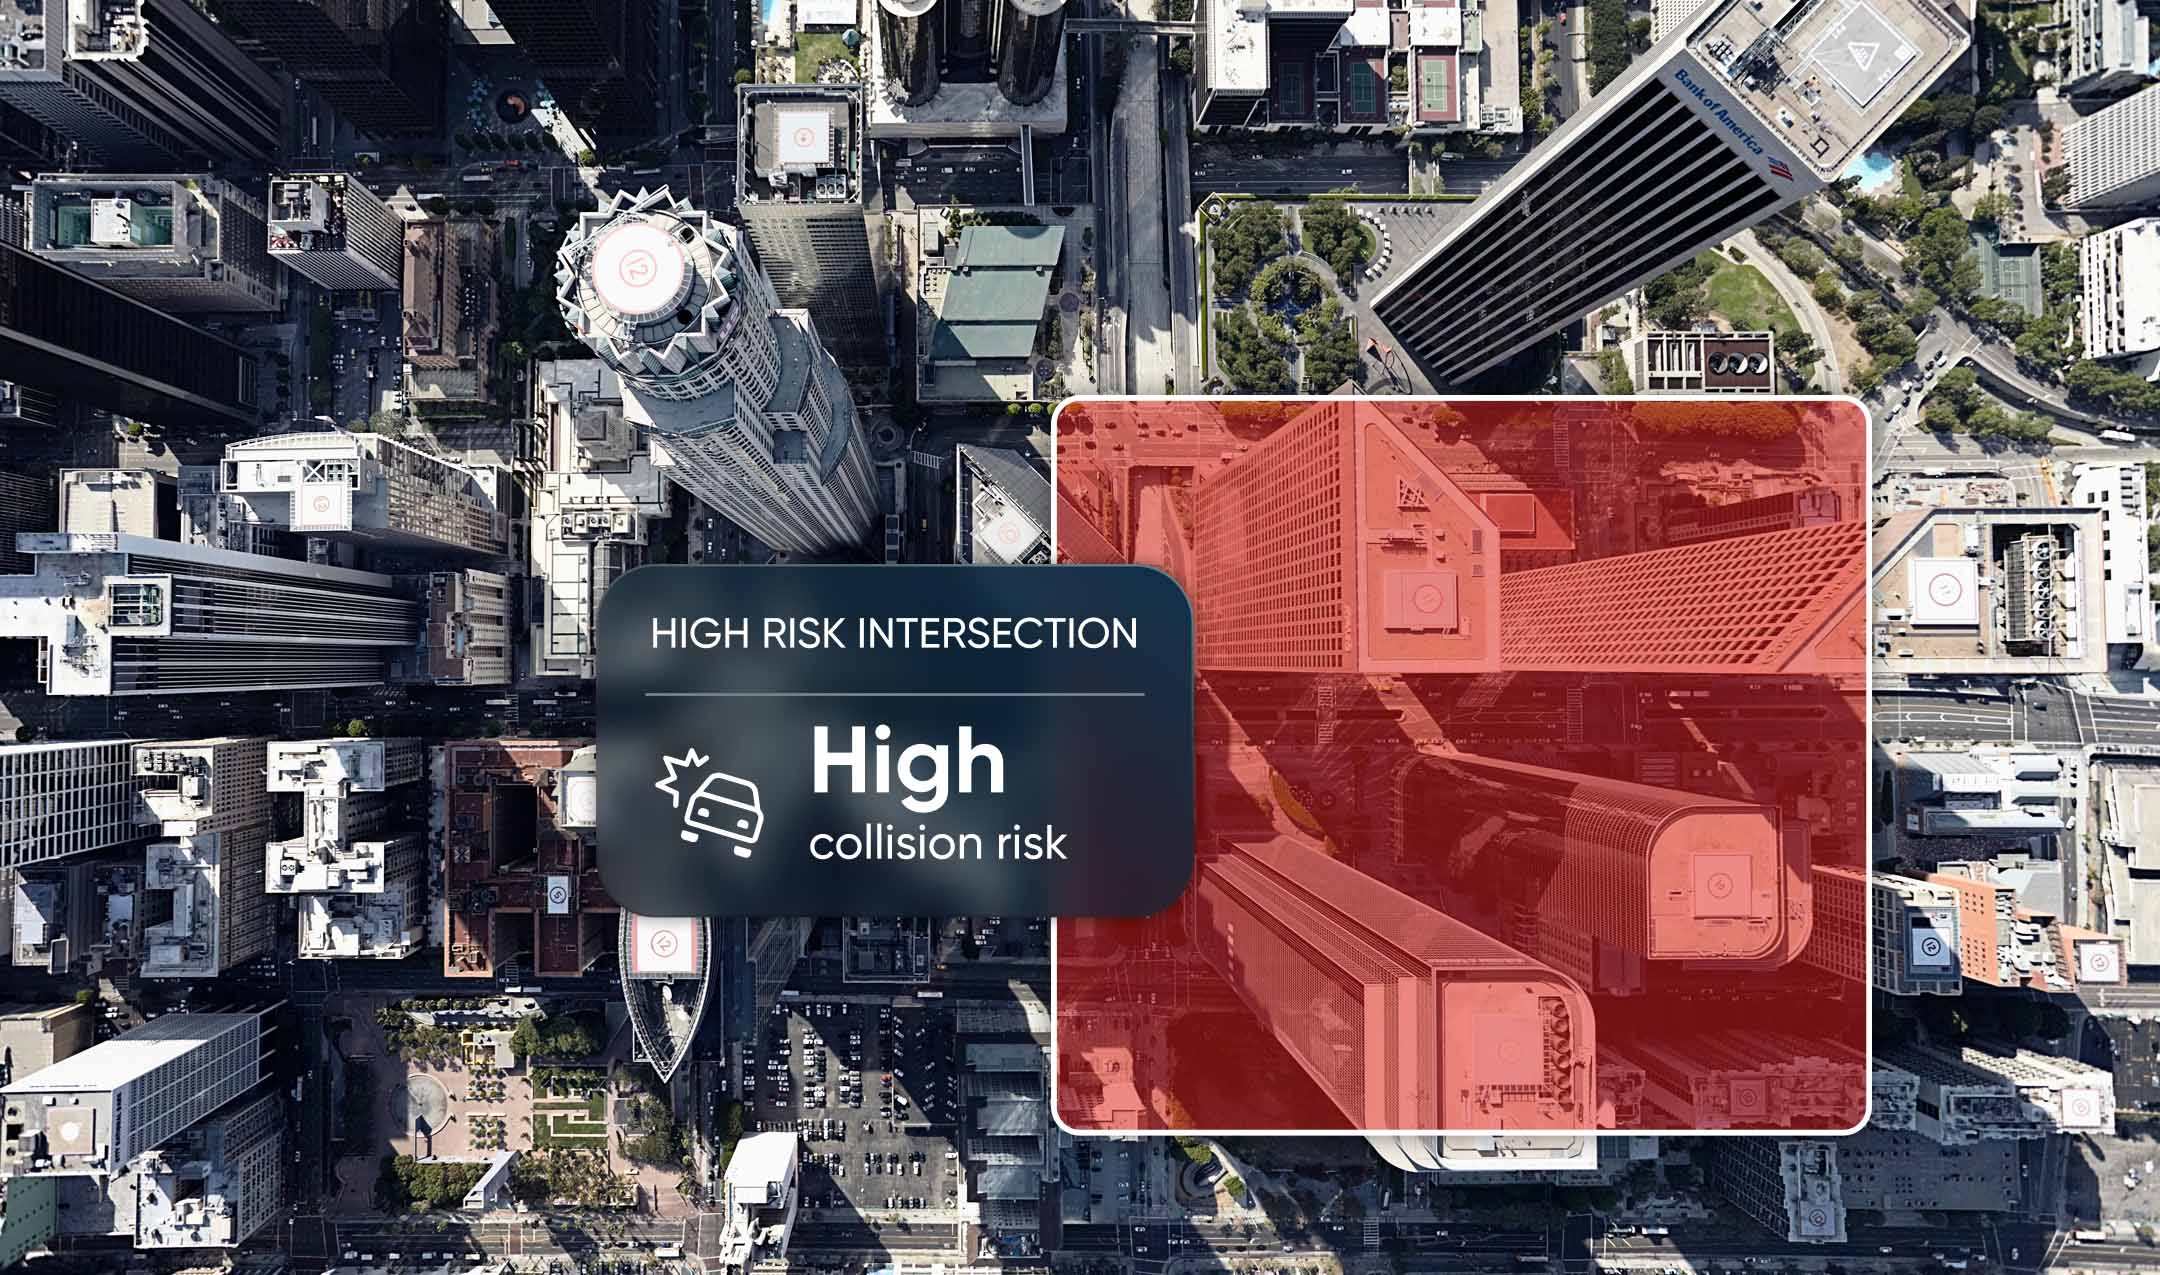 TomTom's maps, traffic insights, speed data, traffic volumes, traffic stats (historical data), and building footprints, combined with other data sources, such as demographic datasets, help insurers build a much clearer picture of risk. Instead of applying the same risk assessment to large geographic zones, they can understand how factors such as traffic congestion, closures, road design, turn restriction, population density and driving speeds influence risk at a more local level. This allows insurers to price policies more accurately, identify emerging risk areas and make more efficient underwriting decisions.
 “Joe Griffin
Senior Consulting Actuary, Pinnacle Actuarial Resources.
Usage-based insurance
Usage-based insurance is built around a simple idea: drivers should be charged fairly based on how, where and when they drive. The challenge, though, is adding context to driving data to accurately support this model. Many organizations have good data on individual drivers but not on the situations in which they drive. For example, harsh braking events. Each case of a harsh braking event could have a completely different context - was it a freeway? Or was there a traffic jam building up? Were there roadworks in progress? Based on the real-world context, the score of the individual driver can be allocated. A driver who brakes suddenly on a freeway could be charged higher when compared to a driver braking on the same freeway, but when there was a jam or roadworks.One of TomTom customers looked into the points of interest to pinpoint the bars in an area and cross reference those with driver behaviors to assess driving risk. It was a way for the insurer to allocate risk scores for certain drivers and to judge if there “could be” cases of rule breaking.
TomTom helps insurers understand the conditions behind every journey, creating a fairer and more accurate picture of risk and allowing insurers to reward safer driving habits and offer more personalized insurance products.Fraud detection and claims validation
Real- world context is the core for claims validation and fraud detection. TomTom data provided in-depth insights into an incidence or a moment in time.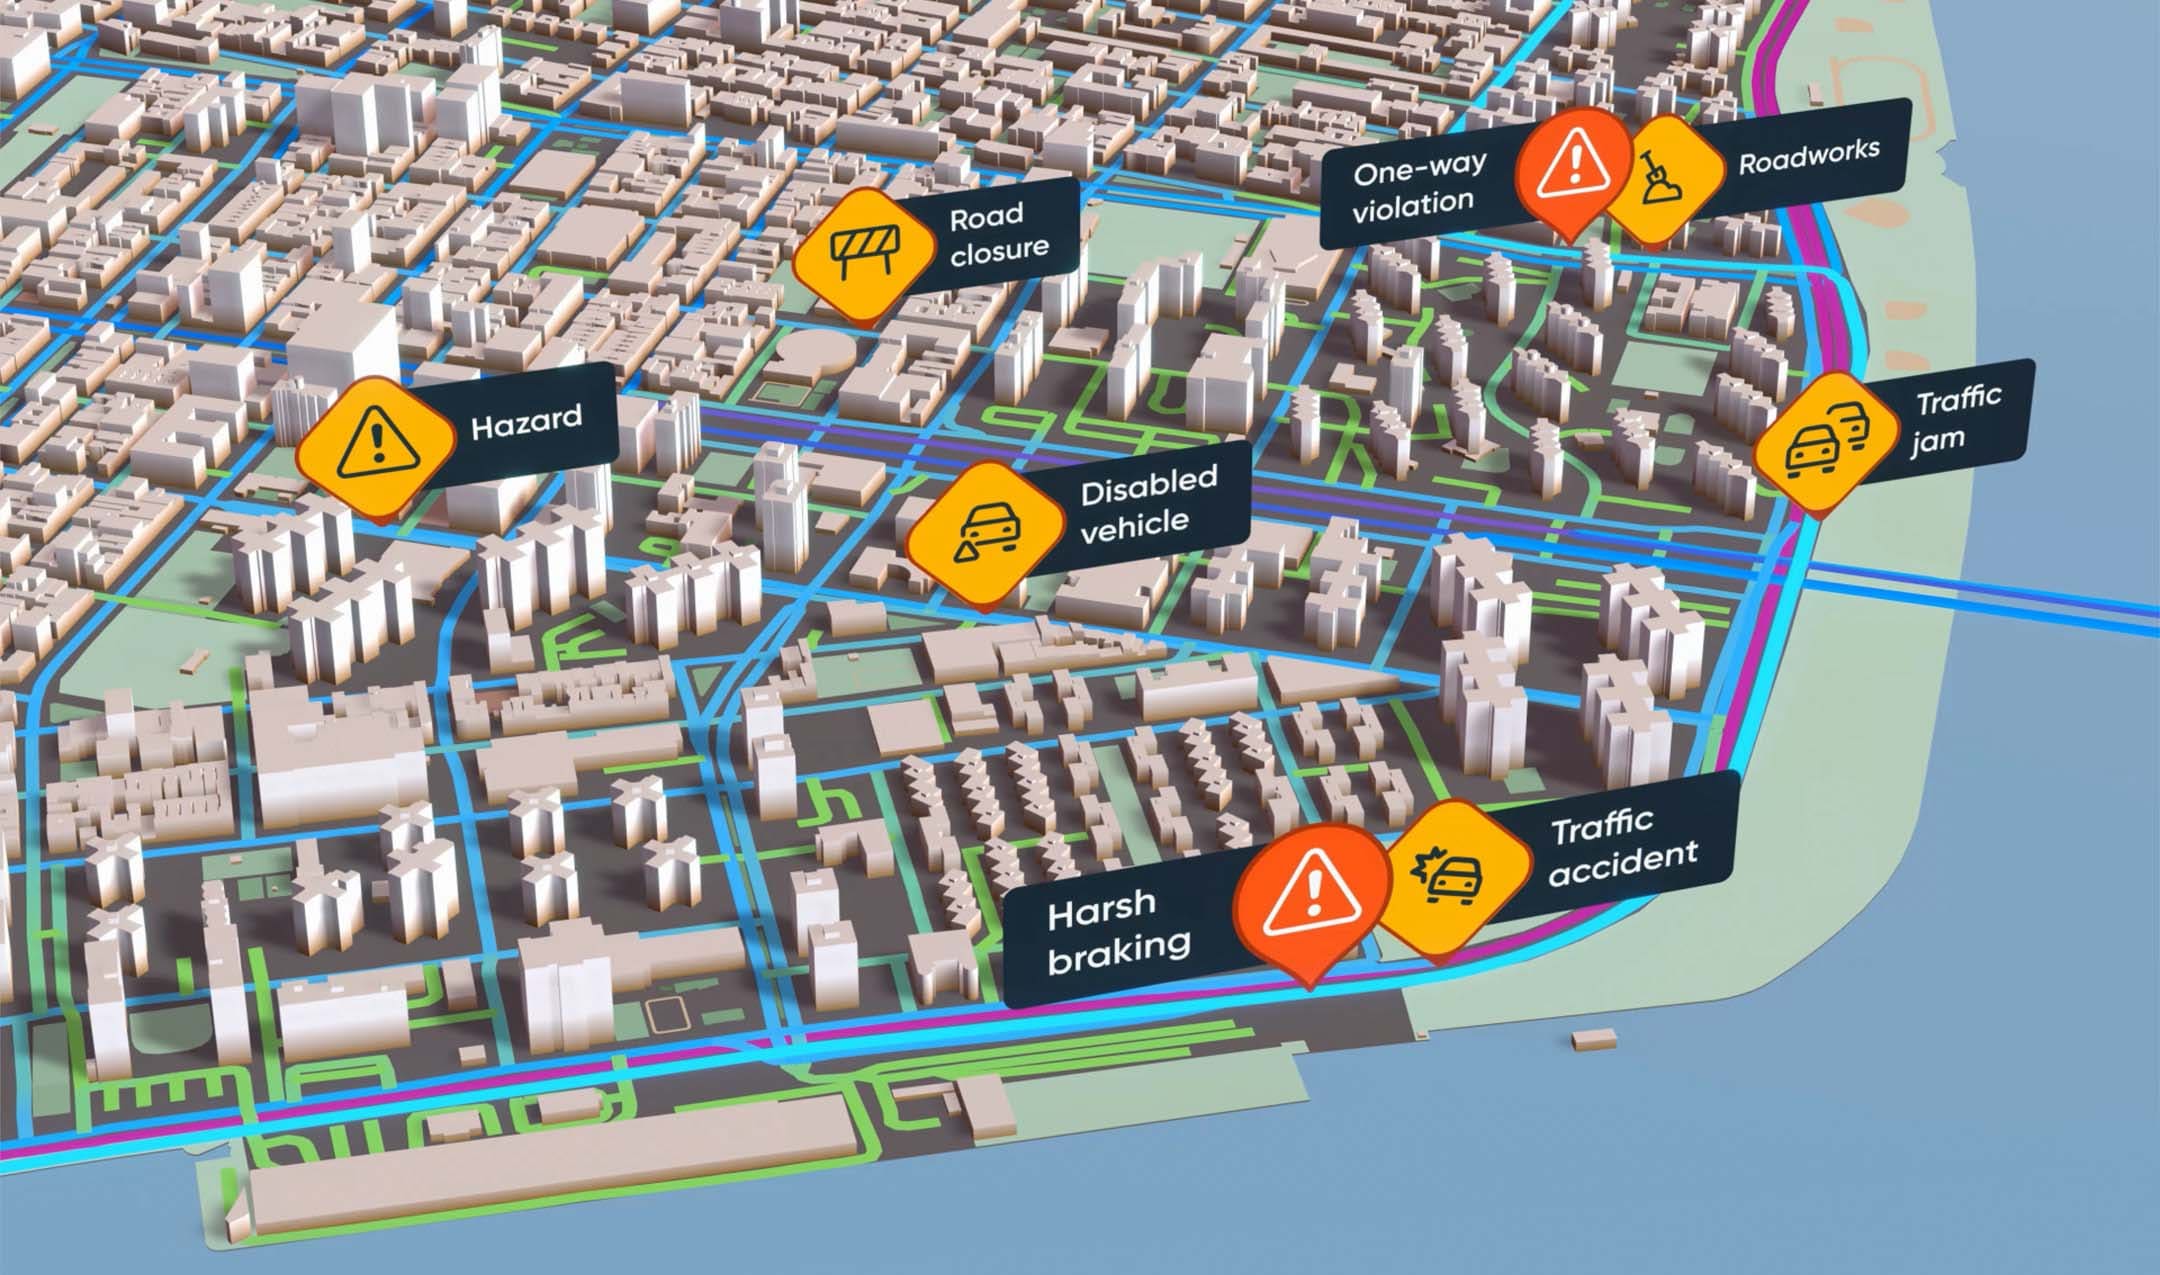 With TomTom data an insurer can look at a single instance in various ways – what is the road layout or the curvature of the road, the speed limits and traffic conditions, what was the weather like, were the roads icy – using rich data insights claims teams can better understand the circumstances surrounding an incident. They can verify whether a reported route was realistic, whether traffic conditions align with the claim and whether the location details are consistent with the reported event. This helps insurers identify potentially fraudulent claims while speeding up the processing of legitimate ones.
A new standard for insurers
As insurance moves toward greater precision and fairness, maps and traffic data are becoming essential sources of truth. By grounding risk assessment and claims validation in real-world movement patterns, insurers can move beyond assumptions and toward decisions built on evidence. The result is a future where policies are priced more accurately, claims are settled with greater confidence, and trust becomes a measurable outcome.
People also read
)
Is your neighborhood restaurant driving up your premium? How location data shapes insurance pricing
)
Location, location, location: Why is this principle still relevant for retail?
)
Why is location data so valuable? Left turns only, nuclear verdicts and bottom-line efficiency
)
How traffic intelligence supports cities in hosting major sporting events
* Required field. By submitting your contact details to TomTom, you agree that we can contact you about marketing offers, newsletters, or to invite you to webinars and events. We could further personalize the content that you receive via cookies. You can unsubscribe at any time by the link included in our emails. Review our privacy policy. You can also browse our newsletter archive here.