)

When looking for a place to live, we all consider the amenities we’ll find in the area. It's handy to have supermarkets, a hospital or a school nearby. And of course, having a few nice restaurants to order takeout from doesn’t hurt. But did you know these could impact the premium you pay on auto or property insurance? That cozy neighborhood café or the traffic-prone road around the corner might be affecting your insurance rates more than you think.
In order to write auto or property insurance policies, insurers consider some obvious factors, such as age, driving record, vehicle type for the former and property age, type, materials used to build it, etc. for the latter. What’s less obvious is the role location plays in helping insurance companies understand and evaluate risk, promising more personalized and fair pricing for consumers.
Building better auto insurance models
Traditionally, insurance pricing has relied on broad, generalized models to inform insurance policies. Insurers would assess risk using zip codes or census boundaries, creating a one-size-fits-all approach that often failed to capture the nuanced realities of individual locations and behaviors. A driver in one part of a zip code might be significantly safer than another, but would end up receiving the same risk assessment.
"Until recently, auto insurance risk assessment models didn’t take into account real-world variables. Every day, traffic patterns change, construction patterns change, traffic volumes shift. But the risk models remained static." Vinod Poomalai, Strategic Product Marketing Manager, Insurtech, TomTom explains.
The inaccuracies caused by this approach didn’t just affect the rates for customers, it also impacted the insurance company’s underwriting profitability and loss ratios, costing it valuable profits, says Poomalai.
These problems can be avoided by incorporating detailed map and traffic data into the risk assessment model — traffic volumes, road conditions, the slope or curvature of the road, how busy it gets at different times of day. By looking at the full picture, insurers can assess the risk of a road or area much more accurately and offer coverage that actually reflects reality on the ground.

But it’s not just where an accident happens — it’s also about who’s driving and how. That’s where location data adds the crucial context that insurers need. Say someone brakes hard. That could mean two very different things depending on where it happens. Doing it in a parking lot is one thing, doing it at a high-speed intersection is another. Additionally, why the driver did so is also an important factor. Did they brake hard because of an accident on that spot, or because of roadworks? By tying driver actions to location context, insurers can tell whether someone is regularly speeding in high-risk areas, making illegal turns or running one-ways, and then use that information to create more accurate, personalized risk profiles. In this way, good drivers reap the benefits through more accurate, fair pricing, while those with riskier behaviors get clear incentives for becoming better drivers.
What’s driving up your property insurance premium?
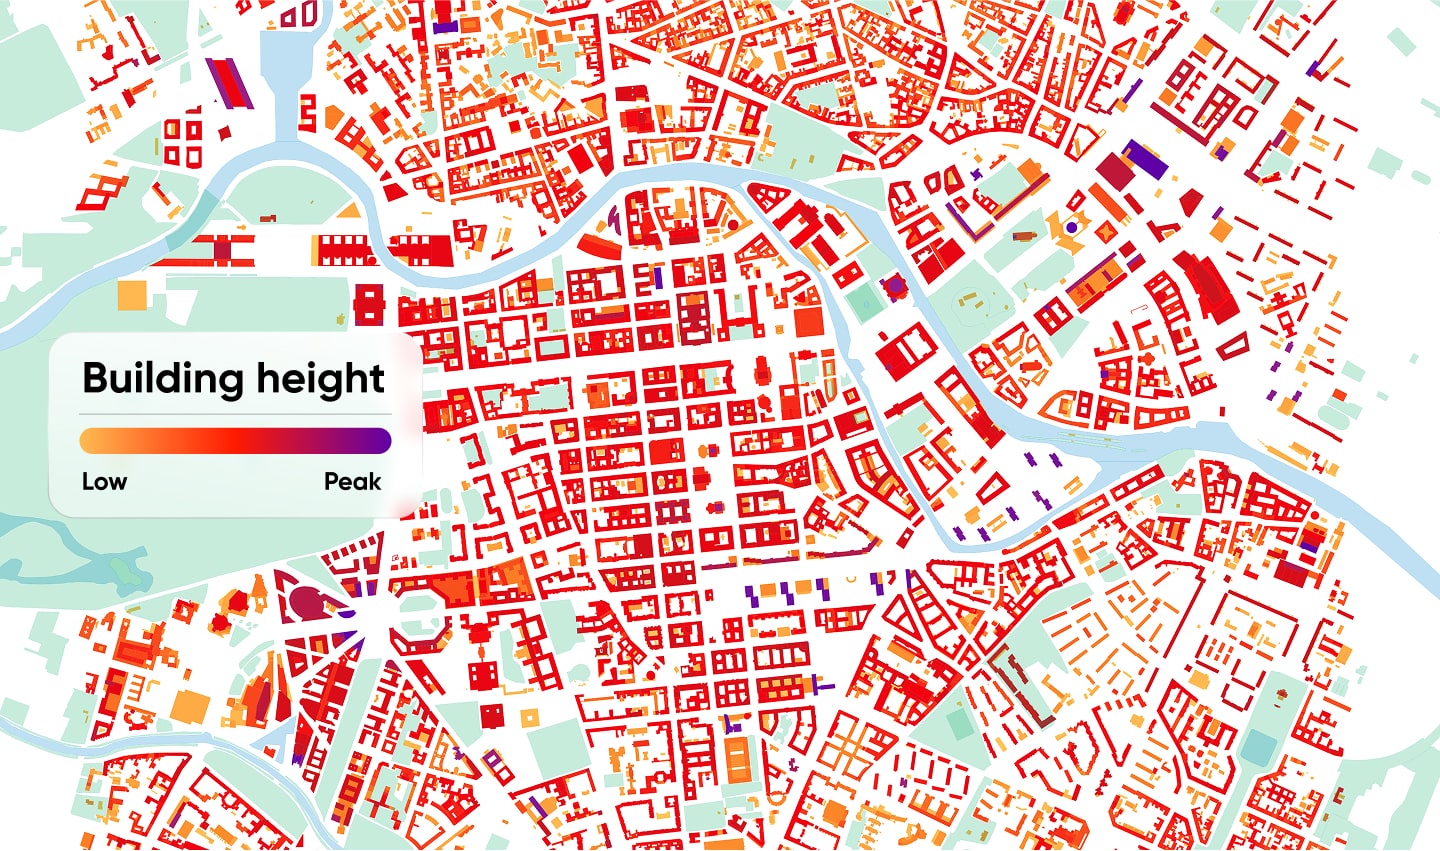
When it comes to pricing property insurance, location really is everything, and not just the obvious factors like the city or neighborhood. Insurers need to understand much more granular details, such as the floor. A third-floor apartment might face very different risks than one on the ground floor, especially in the event of a fire or theft. Another factor that would make a difference is the property’s proximity to important emergency services.
“How close is the property to the nearest fire station? How quickly can emergency services respond? Are there enough fire hydrants nearby?” Poomalai explains.
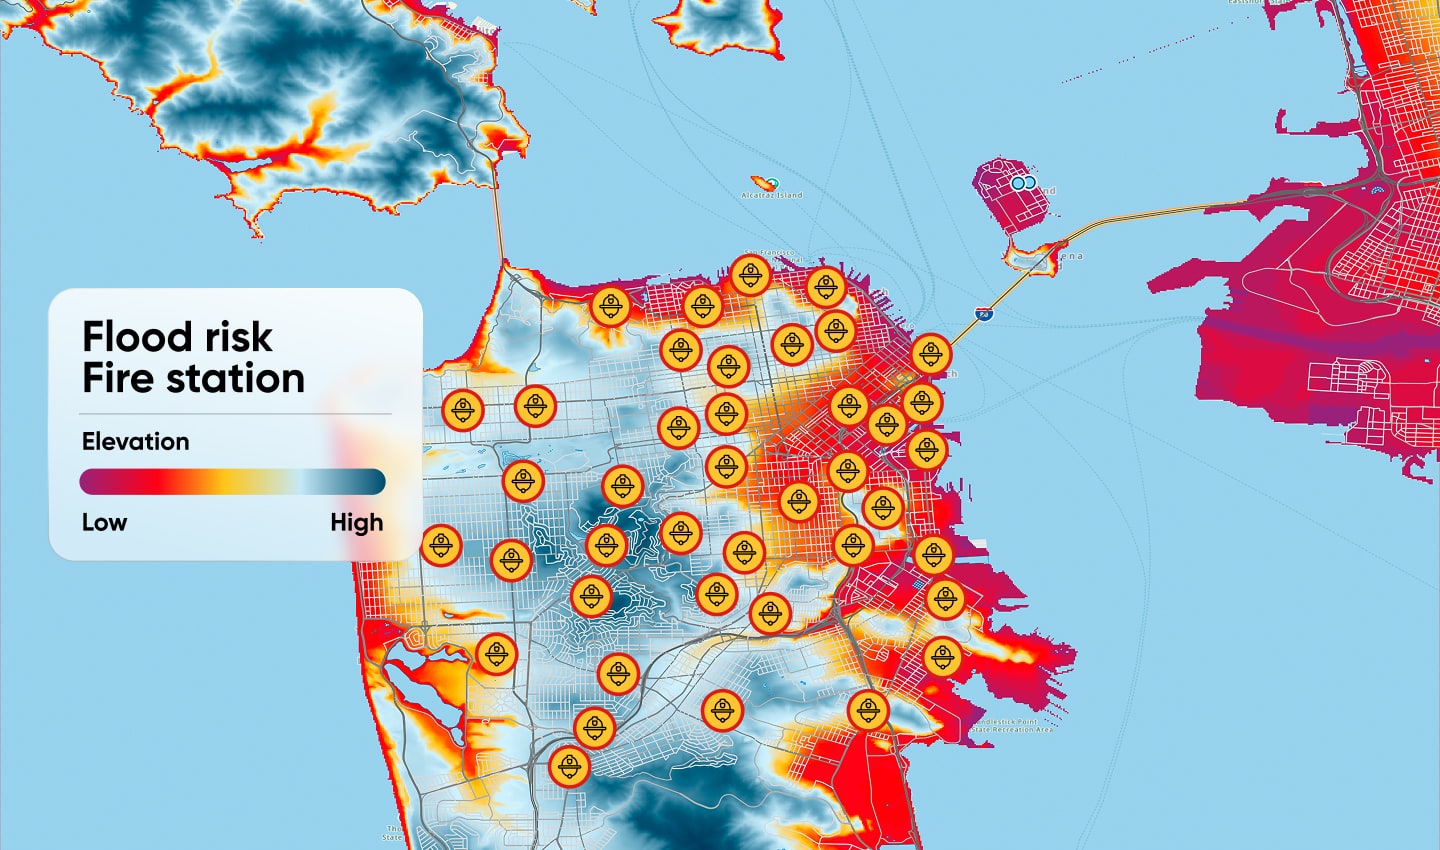
“These are the kinds of questions that should influence how premiums are calculated, but this level of detail is often missing from the data insurers have had until now.”
With precise data on points of interest (POIs) like fire stations, restaurants, forests and even proximity to disaster-prone zones, insurers can learn a lot about potential risks. If you live near a wildfire-prone area in California, for example, or run your business close to a restaurant with a large kitchen, that should factor into your policy pricing. Without such intricate, contextual information, insurers often end up either undercharging — putting themselves at financial risk — or overcharging, which drives customers away. With the right location intelligence, insurers can strike the right balance and build smarter, fairer property insurance products.
Verifying claims with context
Location data acts as the secret tool for insurers to not just improve risk assessment, but also in validating claims and spotting potential fraud. For example, if someone reports damage to their car due to a storm, insurers can quickly verify if that storm actually occurred at the reported time and place.
This contextual insight helps insurers move faster on legitimate claims, making things smoother for honest customers, while also flagging suspicious patterns that might suggest fraud.
Next time you’re taking out an insurance policy, consider if your insurer incorporates location data in their decision making — it could make a world of difference.
People also read
)
Technology to reshape road safety for everyone
)
From manual counts to big data and beyond, the limitless possibilities of traffic data
)
Inside TomTom's Traffic products: Traffic Stats
)
Inside TomTom's traffic products: Traffic Incidents
* Required field. By submitting your contact details to TomTom, you agree that we can contact you about marketing offers, newsletters, or to invite you to webinars and events. We could further personalize the content that you receive via cookies. You can unsubscribe at any time by the link included in our emails. Review our privacy policy. You can also browse our newsletter archive here.