)
There was a time when gathering and analyzing data was a struggle. In 1880 the American census took eight years to compile and analyze. Thanks to computers and specialist analysis software, it now takes well under a year to gather, compile and declare census results. Traffic data has followed a similar trajectory, and today, errors are minimized, and data can be collected, analyzed and put to use within minutes rather than months or years.
A brief history of traffic surveys: From manual counts to real-time floating car data
As David Albright’s 1991 paper, History of estimating and evaluating annual traffic volume statistics, explores, there have been traffic surveys just about as long as there has been traffic. And the data collection methods have evolved as researchers seek greater accuracy and increased collection and analysis speed.
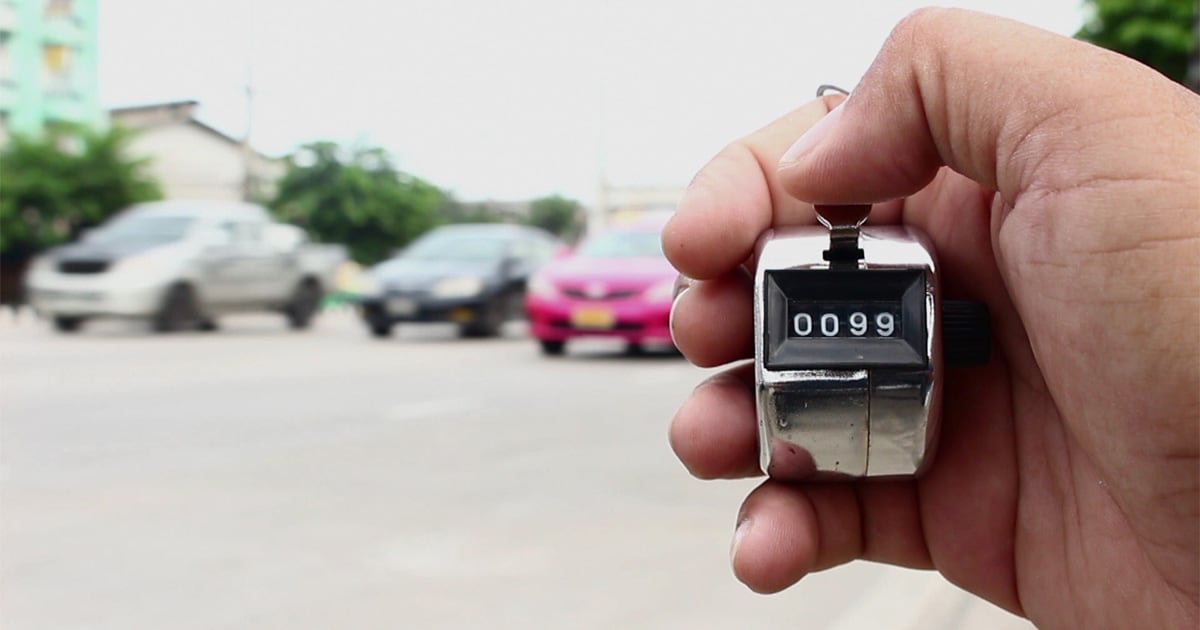
In the early days, the 1930s, surveys relied heavily on meticulous and labor-intensive manual counts. Data collection operatives would stand at busy junctions or by the side of a road and manually count and write down how many vehicles drove past in a given period. Counts would be conducted periodically every month or quarter year to build up a picture of traffic flow.
The 1940s saw the introduction of mechanical counters that removed the tolerance of error created by human operatives, and could be run for two, three or four days without a break. These counts removed human error, but still needed to be statistically adjusted to provide a picture of traffic over the course of a year, in a given location.
Over the next couple of decades, the focus was on improving the statistical analysis of gathered data, rather than improving collection methods. Many researchers attempted to normalize, adjust for error and improve the integrity of data.
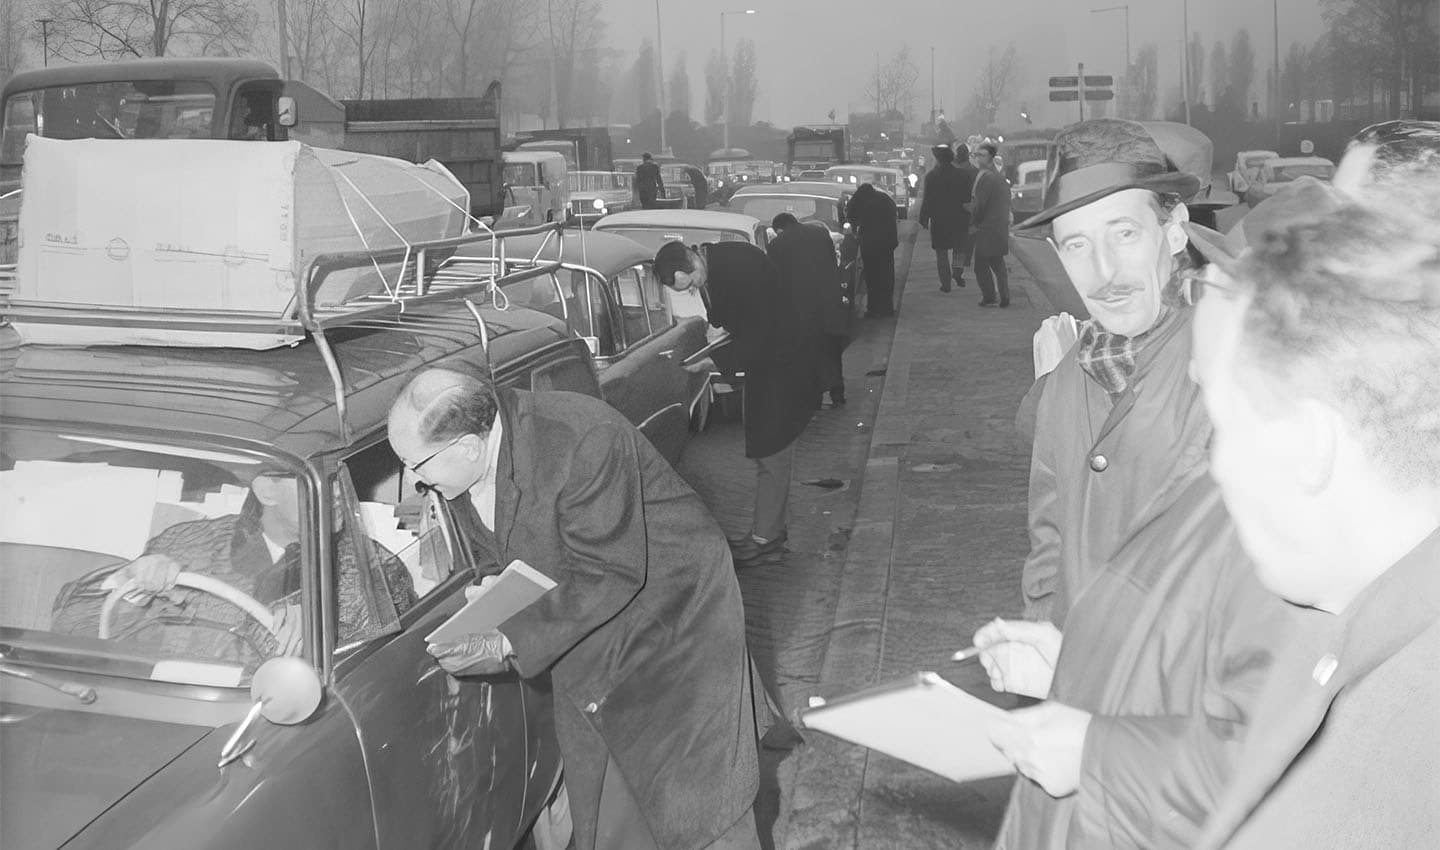 Before sensors and big data traffic surveys took a lot of people, a lot of time.
Some advancements did lead to great accuracy in determining traffic volumes, but the results were still just best estimates. Estimating traffic in one city required a small survey, which was then extrapolated, based on evidence from other surveys, to provide a bigger picture estimate of traffic volumes.
Fast-forward to today, and there is a lot less ambiguity when it comes to traffic surveys, data and the insights we can gather from their analysis. It’s easier, cheaper and faster to gather traffic data, and with machine learning, artificial intelligence and digital mapping, it’s easier to analyze it too.
Today, traffic data is gathered from a variety of sensors. There are in-road induction loops that count vehicles that pass over them — these are generally low-cost and very reliable. Video cameras that can provide a real-time aerial view of traffic are also used as traffic sensors. When coupled with computer vision, AI-powered programs can observe the video captured, and count vehicles that pass the camera’s location — the software can even discern vehicle type and velocity.
The modern day of traffic data collection
While these sensors are accurate, affordable and can run around the clock, they are still tied to a geographical location, and only give insight into traffic at that location.
Perhaps then, the holy grail of traffic data, is Floating Car Data (FCD). A form of traffic data that comes directly from vehicles, giving us insight into where and when they travel, their velocity, their acceleration and deceleration and their type. By combining data from vehicle sensors, like the tachometer for speed, with time-stamped GPS waypoints, we can examine traffic everywhere, all at once, with immense accuracy.
Add a highly accurate map and contextual observations from other location data and on-vehicle sensors like cameras and LiDAR, and the level of detail and insight becomes staggering.
Ninety years ago, it took months to understand traffic flow at just one junction, today we can analyze a whole city of junctions in minutes, thanks to FCD.
FCD can be derived from cell-networks, where cell phones become the sensors. This source can be useful due to the sheer number of mobile devices, however, analysts face similar issues to those faced by traffic researchers in the mid-1990s — they have to account for errors and integrity issues that stem from the fact that cell phones are not directly connected to vehicles.
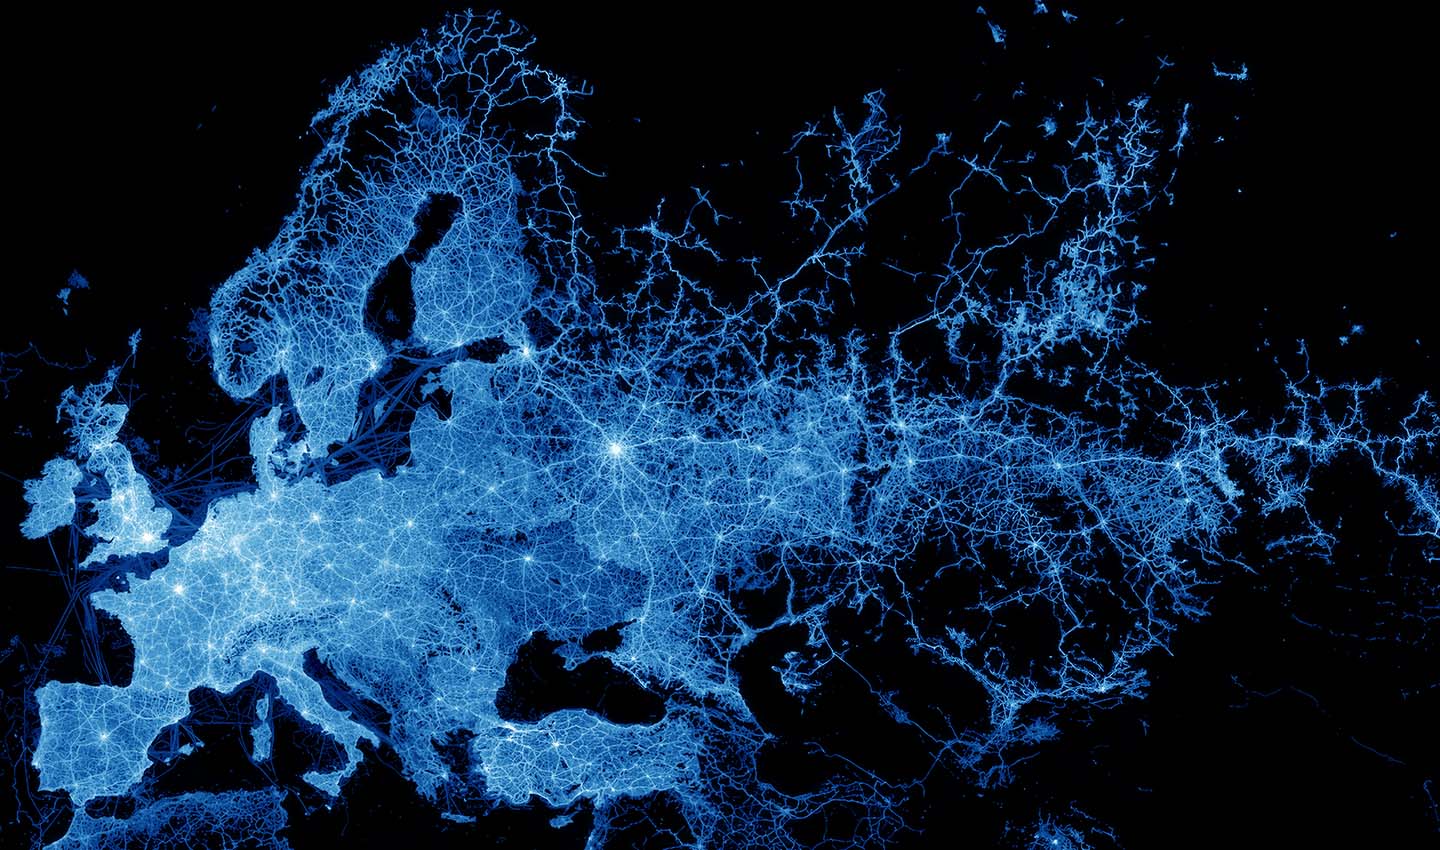 A map of Europe made entirely using floating car probe data.
The most reliable source of FCD comes from GPS-based sources, such as those devices directly connected to a vehicle’s navigation system, and other on-board sensors.
Covering more than 3.5 billion kilometers, backed by more than 600 million connected devices, TomTom has become the leading name in high-resolution, GPS-based floating car data. That equates to more than 1 in 5 vehicles on the road, on average, reporting data back to TomTom.
When data comes directly from vehicles themselves, traffic data as a whole becomes a lot more useful and reliable. As TomTom’s own Jeroen Brouwer explained in a recent interview with Intertraffic, in the modern world where city planners, engineers and infrastructure developers are demanding more map and traffic data and they want it delivered ever faster, FCD is the go-to tool.
What's possible with traffic data today
With accurate traffic data so widely and densely available, gathering it is less of a concern for researchers. Instead, it’s all about analyzing it and extracting as many detailed and useful insights as possible. Traffic data is not just about spotting jams or roadworks, it can be about understanding how to build new roads, schedule maintenance or set the optimal traffic signal timing. It can also be about knowing where to install electric vehicle chargers or road lighting, where to place public transit stops and much more.
Two companies, that have recently started working with TomTom exemplify what’s possible with traffic data. StreetLight and Flow Labs are both in the business of traffic data analysis. They work with municipalities, city councils, engineers, traffic managers and infrastructure designers to improve the way our cities move, ease traffic flows, increase road safety and decrease emissions.
StreetLight Data Inc. focuses on understanding how people move and how transport functions. With its proprietary machine learning and big data analysis platform, StreetLight is able to illuminate what’s going on in our cities.
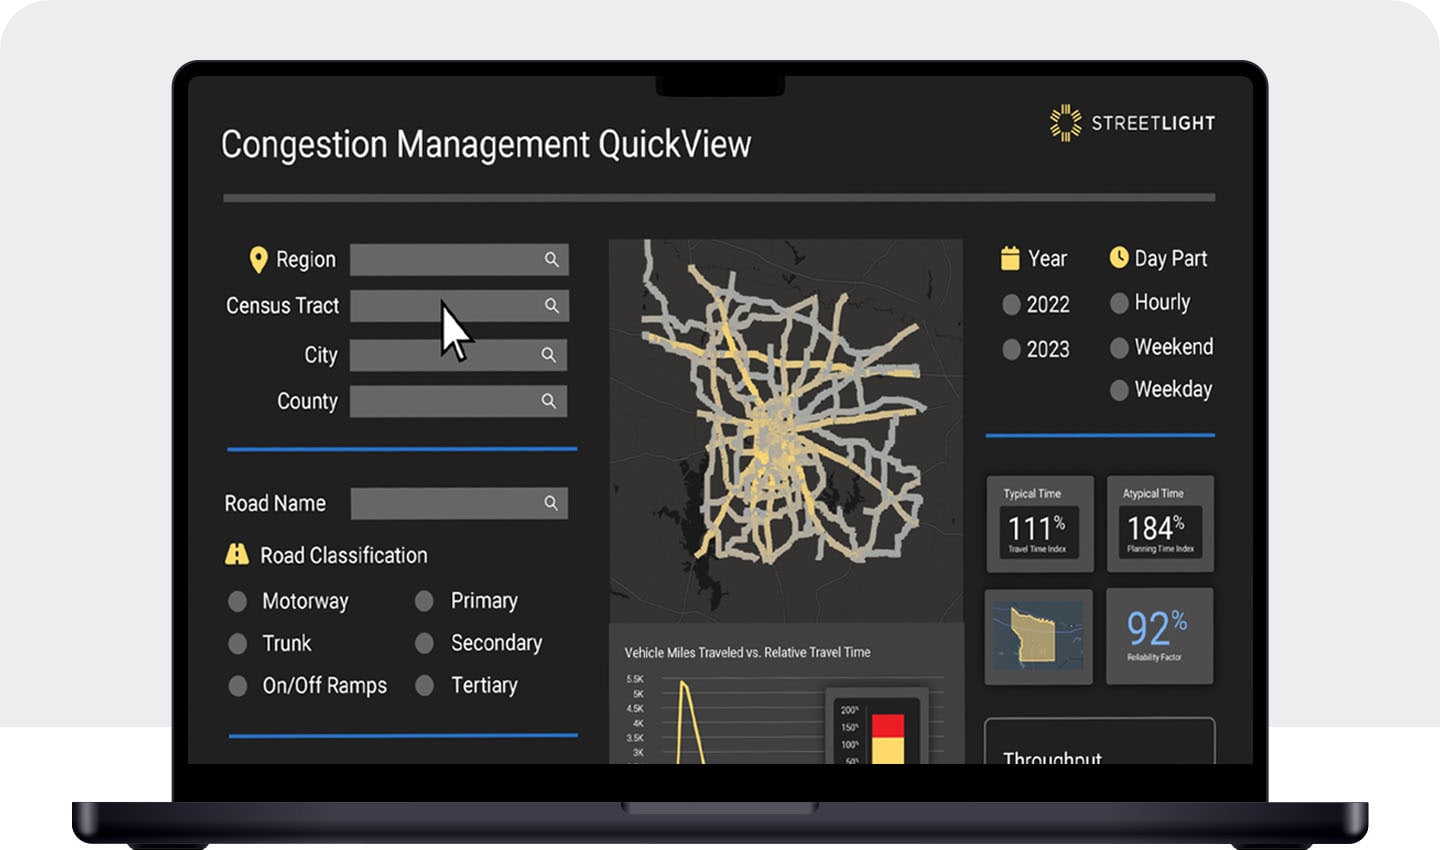 StreetLight's traffic management interface
Built on TomTom’s FCD and historic traffic data and made available through its InSight® software, StreetLight’s insights help its customers answer difficult questions about city infrastructure, such as how to allocate billion-dollar road maintenance budgets, where to install EV chargers, how to make roads safer for all and how to improve traffic flow and reduce emissions.
With greater global coverage, TomTom’s data allows StreetLight to take its solutions to a bigger audience, and further empowers it in its mission to combat climate change and improve transportation for everyone.
Similarly, Flow Labs uses AI to enhance its digital solutions to help “transportation agencies, engineers, consultants and cities identify and solve key transportation issues.”
Using mountains of data, including TomTom’s storied traffic data, Flow Labs aims to make the world’s roads cleaner and safer. The company says its traffic management platform, called Optimus, can reduce peak travel times by 24% and reduce emissions by 21, by optimizing traffic light signals on -demand. This is the first time TomTom data has been used to support live signal optimization.
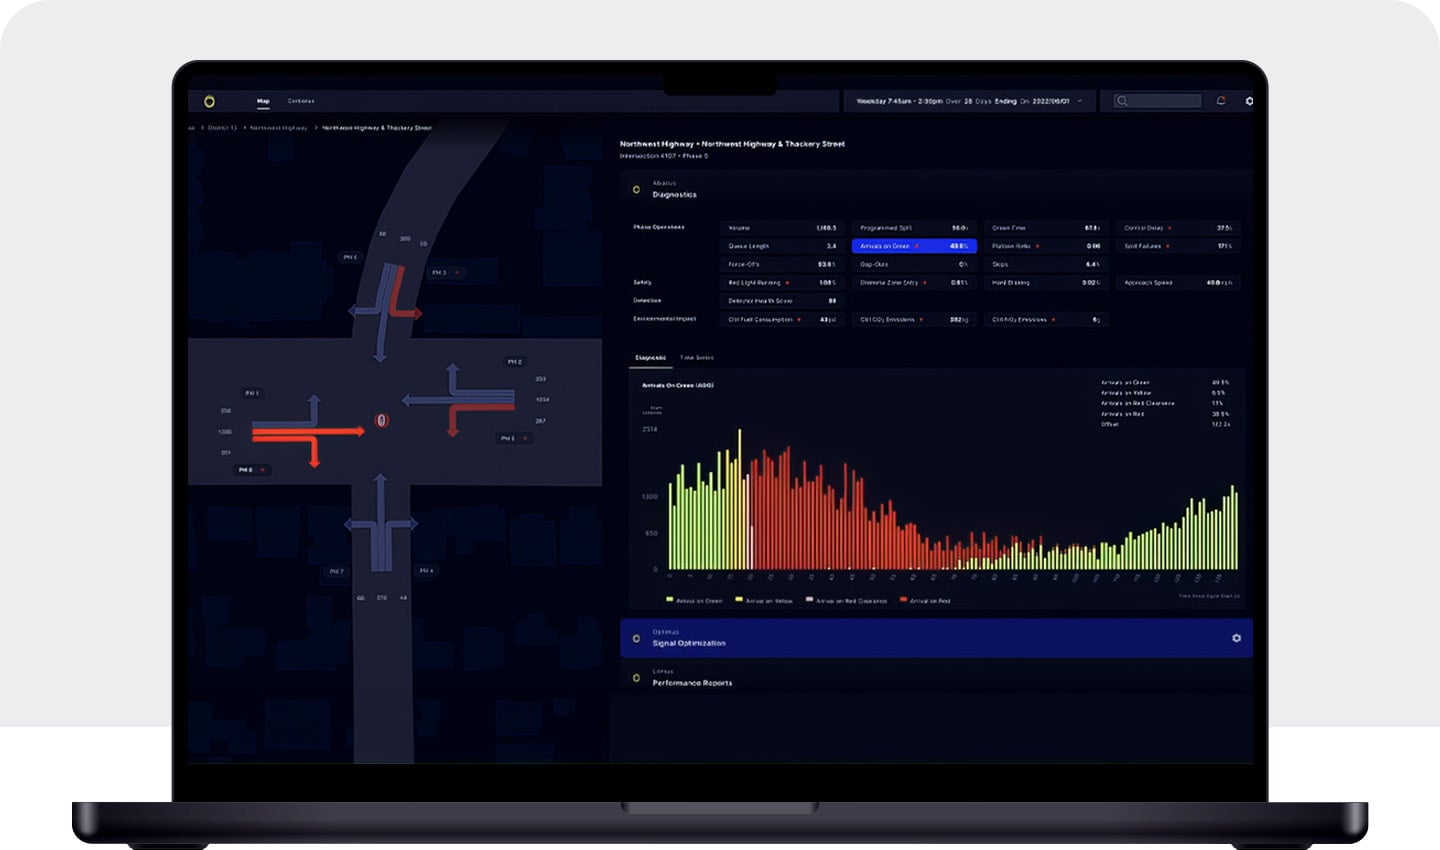 Flow Lab's interface for junction analysis.
The end of the traffic survey?
With TomTom, both these companies are tackling the biggest challenges in the industry and helping cities achieve goals related to sustainability, efficiency and livability.
Alongside TomTom, companies like StreetLight and Flow Labs have ushered in a new era of traffic surveying. Groups of Hi-Viz wearing, clipboard wielding researchers camped by the roadside counting cars are now firmly a thing of the past.
Thanks to machine learning, computer vision and AI, complex, detailed and highly reliable traffic studies can be conducted in minutes, variable speed limits and traffic light signals can be optimized in real time. Those traffic researchers back in the 1930s would surely marvel at what we can do now.
And of course, none of it would be possible without the data.
* Required field. By submitting your contact details to TomTom, you agree that we can contact you about marketing offers, newsletters, or to invite you to webinars and events. We could further personalize the content that you receive via cookies. You can unsubscribe at any time by the link included in our emails. Review our privacy policy. You can also browse our newsletter archive here.