How monitoring facilitates accurate and efficient map delivery
&w=256&q=90)

At TomTom, everything starts with map data. Digital maps are our core asset and it’s important to keep them updated to reflect reality in real-time. How does our system ensure we deliver maps accurately and efficiently?
Our map-making platform can introduce over one billion changes on a monthly basis to the world map repository. In order to ensure accuracy, we check every change against strict quality rules before going live. Currently, we have defined around 3,000 business checks. Every change is traceable in terms of operations performed, as well as accountability.
Additionally, our system delivers data via its read interface to the tools that transform our internal map representations to formats required by our business partners. All of this happens in real time. A lot of elements go into our platform and require heavy processing, which means that even small system outages can be costly and inconvenient. In this blog post, we explain an important part of the architecture that helps us minimize downtime risk: monitoring.
Basic architecture
Our monitoring system consists of three main pillars:
- Prometheus with Alert manager
- ELK stack (Elasticsearch/Logstash/Kibana)
- CloudWatch
Prometheus collects metrics that are indicated by numeric values, such as CPU usage and data. These metrics are transferred with the attached metadata, such as the instance name and network interface identifier.
We mainly use ELK for gathering application logs containing detailed information about processed transactions, time taken and operation result.
CloudWatch acts as a supplementary tool that provides information on our AWS managed services. This infrastructure collects around 75 million metrics and logs per hour. We also extract other useful information from this data stream, including signals, which help with automatic traffic shaping, preventing downtime, fulfilling SLAs and sometimes, unfortunately, waking up on-call team members.
Traffic shaping
When our system was introduced into production, our monitoring capabilities were limited – we knew that we had downtime, however, finding the root cause required considerable time and manual work. As time went by, we gained more experience and could react faster, but we wanted to do even better. A closer look at the system revealed that most of our problems were coming from overloaded database instances.
Heavy queries required greater processing power (both in terms of CPU and I/O) causing increased response times, timeouts and, as a result, spikes in the failure rate. Our first response was to develop a component called "database throttler", which is used to detect overloaded instances and limit the number of queries that are executed. We implemented this by limiting the number of available connections assigned to a given database user. It improved our system’s stability and predictability.
Then, we discovered another possible limitation of the database throttler to improve on – our granularity, which was working on a user level. In our system, the database user is assigned per functional cluster (basic cluster division is latency bound vs throughput bound, the second category is writeable vs read-only). Part of the systems dedicated for tools ingesting map data were used by dozens of different software components. A single tool could cause overload of a database instance, which ultimately throttled the whole functional cluster. Thus, we wanted something that could give us control on a more fine-grained level.
API management for accountability
We decided to introduce API management. It usually enables AAA (Authorization, Authentication and Accountability) implementation. In our case, we were mostly interested in accountability. Our customers received dedicated endpoints and, as soon as their API call reached our backend, it was already provided with information regarding the request originator. With significant refactoring effort, we carried that information across all our webservice layers. Finally, this metadata trace was attached to the query executed on the database engine.
With the help of Prometheus, we collected that data to find out:
- How much database processing time queries of a given endpoint took (approximately).
- How many queries were originated by a given endpoint.
This information reflected the ratio of processing power taken by a given endpoint on a particular database and it became a good indicator of the origin of overloaded instances.
Thanks to the above features and collected data, we were able to detect overloaded database instances and track down the endpoint that was most likely the root cause. Now, we needed something that would let us influence the given endpoint’s behavior. Here, we used one of the standard features of API management – rate limiting, which was dynamically adjusted. Additionally, we have introduced the exponential backoff feature in our API client library, which slows down the pace of sent requests whenever the endpoint limit is reached.
Together with the dynamically set request quotas per endpoint – based on Prometheus alerts – we had more control over the flood of heavy queries. In short, it works in a way that whenever a database is overloaded, the endpoint with the biggest ratio in the total executed query time is identified and its quota on API management is decreased, resulting in a slower pace of incoming requests.
A side effect of this approach, we have learned, is that sometimes, even if the given endpoint was throttled down to one request per minute, it still overloaded the database. How is that possible? Our system is highly parallelized – this means that a single request sent by a client is forked into dozens of sub-requests towards other components, such as web services and databases. Identification of such “killer requests” helped us find and improve weak spots in our software. We have also implemented a handler that is triggered by the overloaded database alert, which terminates queries abusing the system. This is used as a last resort when all other measures are not helping.
The dynamics of our system
One important element to keep in mind is that overloaded databases might not necessarily be caused by a flaw in the software’s design. Our system is very dynamic and is capable of adjusting its backend performance to fulfill the demand, so higher loads on certain parts of the system can also mean that we need to scale it out.
Throttling, in this case, results in slowing down the incoming requests flow to the part of the system that is currently adding processing capacity Ultimately, this allows us to operate without impacting the success rate. Databases have significant scaling inertia (compared to web services) and temporarily withholding the stream of requests buys us time to operate more efficiently.
Ensuring balance and stability
Another function of our traffic shaping feature is setting request quotas to the default level. When a given endpoint is not used for some time (usually a couple of hours) its quota is set to a safe level that will protect the backend against an uncontrolled burst of requests. "Flattening" the incoming traffic also allows us to scale out if that is required.
So far, all described cases have been about throttling down the endpoint. If we took this approach in every case, sooner or later, there would be no incoming traffic to the system. Fortunately, there is also a mechanism to upgrade the quota for the client.
Thanks to the data we have collected, the monitoring system knows which endpoints' requests are suffering from being limited. In cases where a given endpoint is not causing overload of any backend's component, a signal is triggered and the proper handler upgrades the quota.
Both parts of the monitoring backend that are responsible for limit regulation of requests work independently. In this way, the overall system constantly looks for a balance where demand, backend utilization and stability are kept at an optimal level.
At the time of writing this blog, the next generation of traffic shaping was released, which introduces improvements in quota limits adjustments for particular endpoints.
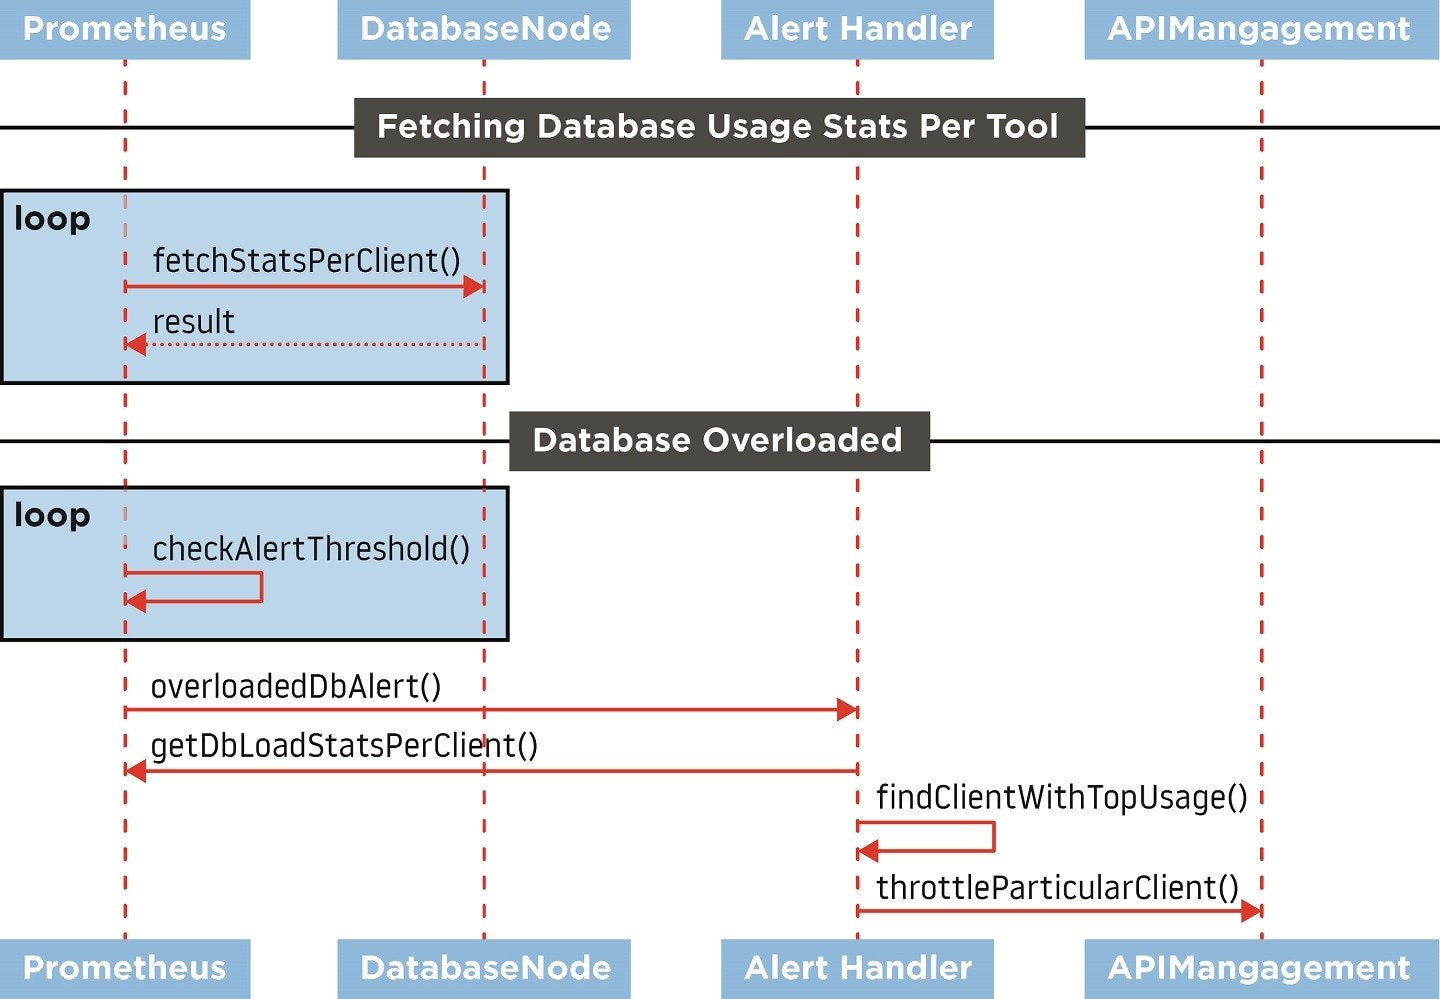 Figure 1. Interactions between components involved in traffic shaping.
Workarounds can be helpful
Apart from taking the structural approach, sometimes you need to implement tactical fixes – also known as workarounds – in order to get things going. In such cases, a properly designed monitoring infrastructure can be helpful.
Some time ago, we observed spikes in response times of certain API calls. At first glance, the system’s health did not indicate anything out of the ordinary – web services were generally healthy; the same observation applied to database clusters.
The SLA was fulfilled, and the only indication that something was not quite right were the increased processing times. Furthermore, we received no complaints from our customers – but we knew that the system was not working at its optimal level.
As mentioned earlier, our system is highly parallelized and components are grouped into functional clusters serving the same functionality or, in the case of databases, holding the same data.
Such an approach enables flexible scaling – depending which part of the backend is currently used by customers, its processing power might be adjusted accordingly (adding a web service or database instance). With the help of parallel computing, the final response returned to the customer is assembled faster than performing it sequentially. However, the response will not be sent back faster than the slower subrequest.
Having realized that, we looked closer at our clusters – especially at outliers when it came to response times. We observed that, from time to time within the database cluster serving the same chunk of data, there were instances with a two to three times higher load than their counterparts. Timeframes of this deviation correlated with the increase in the overall system response time.
We quickly created alerts that detected such situations, and the alert handler took out such instances from the production traffic, allowing it to return to normal load levels. The workaround gave us comfort and time to focus on finding the root cause of the problem, knowing that this prevention mechanism will save us from trouble.
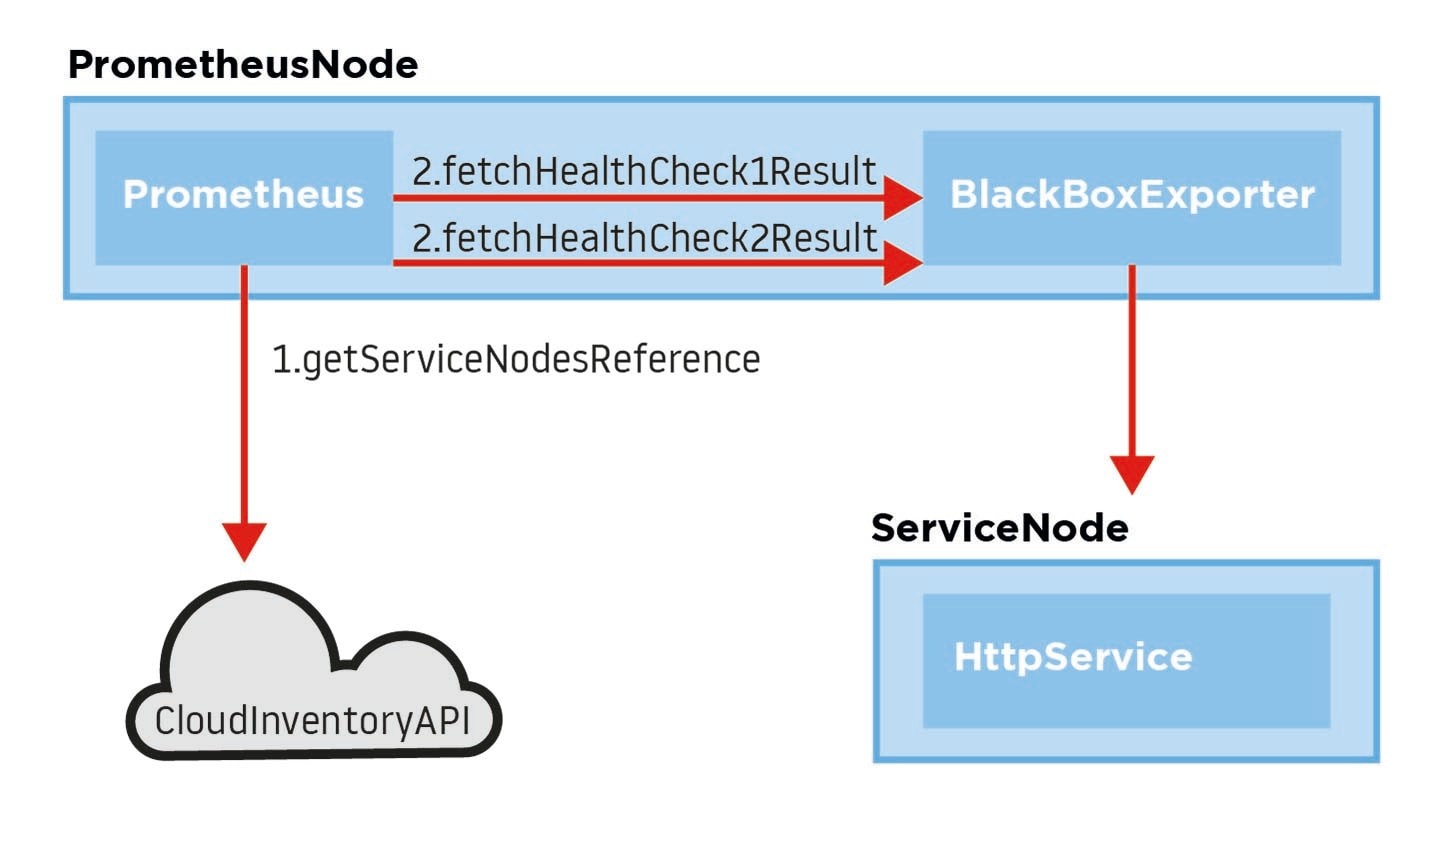 Figure 2. In a highly parallelized environment final response depends on the slowest part of the subsystem.
So, what was the root cause? This situation revealed a tricky bug in our customized load balancing algorithm.
Is your service healthy?
A significant part of our backend is composed of different web services. Not all of them are cloud native, some of them can be described as monolithic. Migrating to the cloud may sound risky and challenging (at any given moment your service can be destroyed and replaced), however, it turned out to be a good opportunity for us. Thankfully, our services are stateless and the very dynamic lifecycle of cloud instances did not have an impact on the stability perceived from our customers’ perspective (retries implemented in a crucial part of the system helped).
When we were still running an on-premises infrastructure, we often suffered from a phenomenon where a single faulty instance was causing downtime. Since response times were fast, the load balancer was sending even more requests, which resulted in an error response conveyed to the client. Handling that situation usually required a restart of the service instance.
Questions arise – why was a health check not helpful? As mentioned above, our core web service communicates with other services, as well as many databases. Having health checks that monitor all functional areas would not be lightweight as it requires heavy processing, thus defeating the purpose of the health check. Additionally, there were a couple of load balancer units sending their own checks, which additionally would overload the service instance with processing those requests. Therefore, we stuck to a basic health check that only informed us whether the application server was alive.
Simpler for a better experience
So, how has migrating to the cloud helped in solving that problem? Basically, cloud load balancers work in a similar way as on-premises ones, so we could not do much with extending the health check for the very same reasons as with our on-premises setup. This is where Prometheus, with its capability of service discovery using cloud features (e.g. tagging resources), comes in handy.
If properly tagged, we could reach every service instance currently running. With the help of the Blackbox exporter – a component that sends the requests on behalf of Prometheus and returns results to it – we could define a lightweight health check. Every health check was precisely probing a single functional area of the system. We were not overloading the service, as health checks were coming from two instances of Prometheus (and not from every load balancer unit).
The biggest advantage with this approach is that once we have detected a faulty service, we could remove the instance immediately – as we know that the cloud provider will replace it as soon as possible.
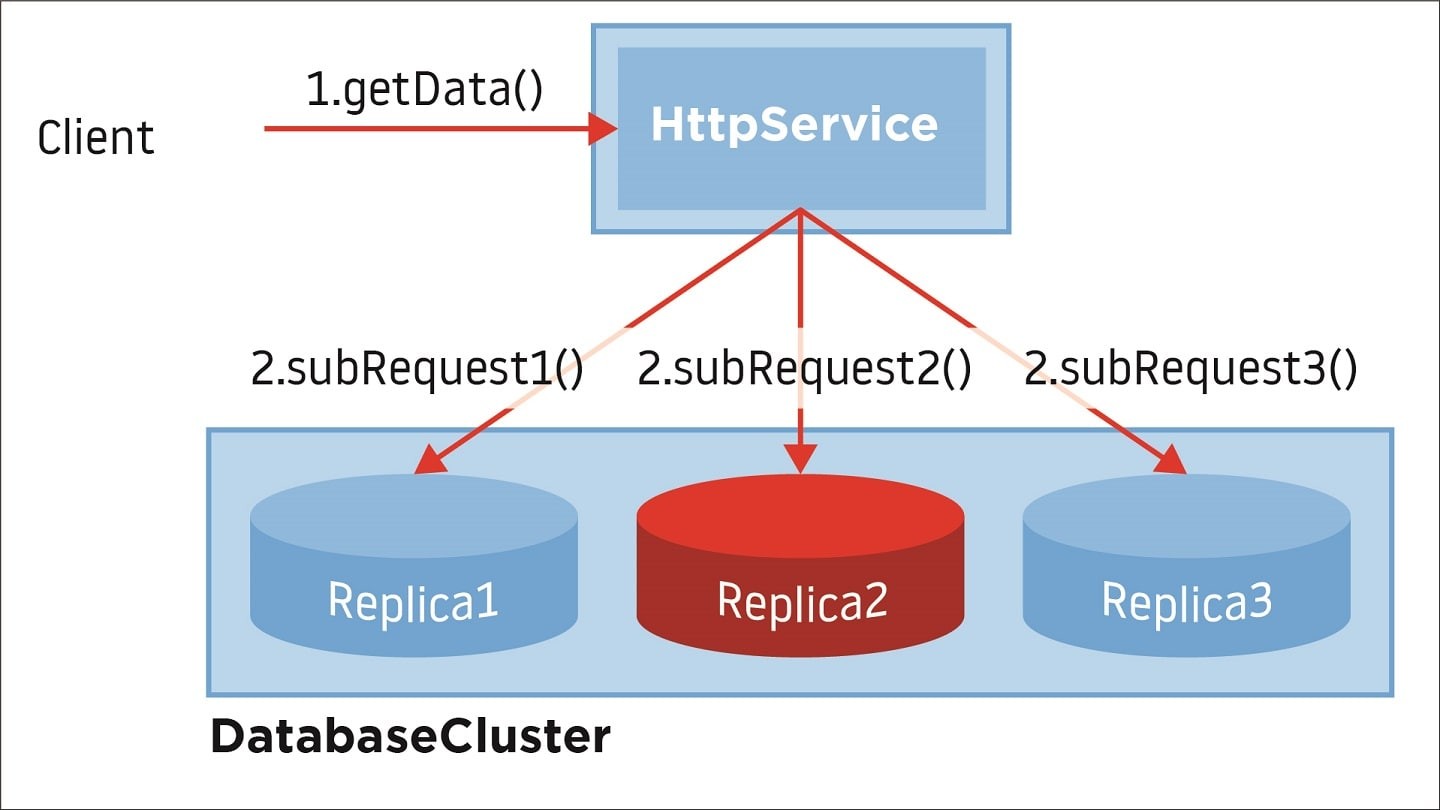 Figure 3. Sending different health checks toward a single service instance.
These are just a few examples of how proper implementation of monitoring is helpful in making our system robust and more stable. While we are still at a point where on-call support is necessary, we’ve discovered ways to prevent downtime more efficiently – helping keep our costs under control and providing a positive experience for the business, our partners and our customers.
People also read
)
How does artificial intelligence improve mapmaking?
)
Behind the map: how we keep our maps up to date
)
How on-demand, mobility and logistics leaders make TomTom maps better
* Required field. By submitting your contact details to TomTom, you agree that we can contact you about marketing offers, newsletters, or to invite you to webinars and events. We could further personalize the content that you receive via cookies. You can unsubscribe at any time by the link included in our emails. Review our privacy policy.