)
For the past few years, cities have been implementing several new safety measures. One of the most noticeable features has been the decrease in speed limits within city boundaries. Taking a look at the data for Bologna and Amsterdam, we try to measure how successful these initiatives have been.
A turning point for urban mobility
In 2024, the European Commission announced a groundbreaking partnership with over 40 European cities to prioritize road safety through the implementation of lower urban speed limits. The goal is clear: safer, more livable streets that put people before vehicles.
The drive to make cities safer, improve the livability and reduce congestion has been a global phenomenon. New York recently implemented congestion charging, but cities across Europe such as Bologna, Amsterdam, London, Helsinki, Bilbao and many more have been working towards larger goals of sustainable city-living.
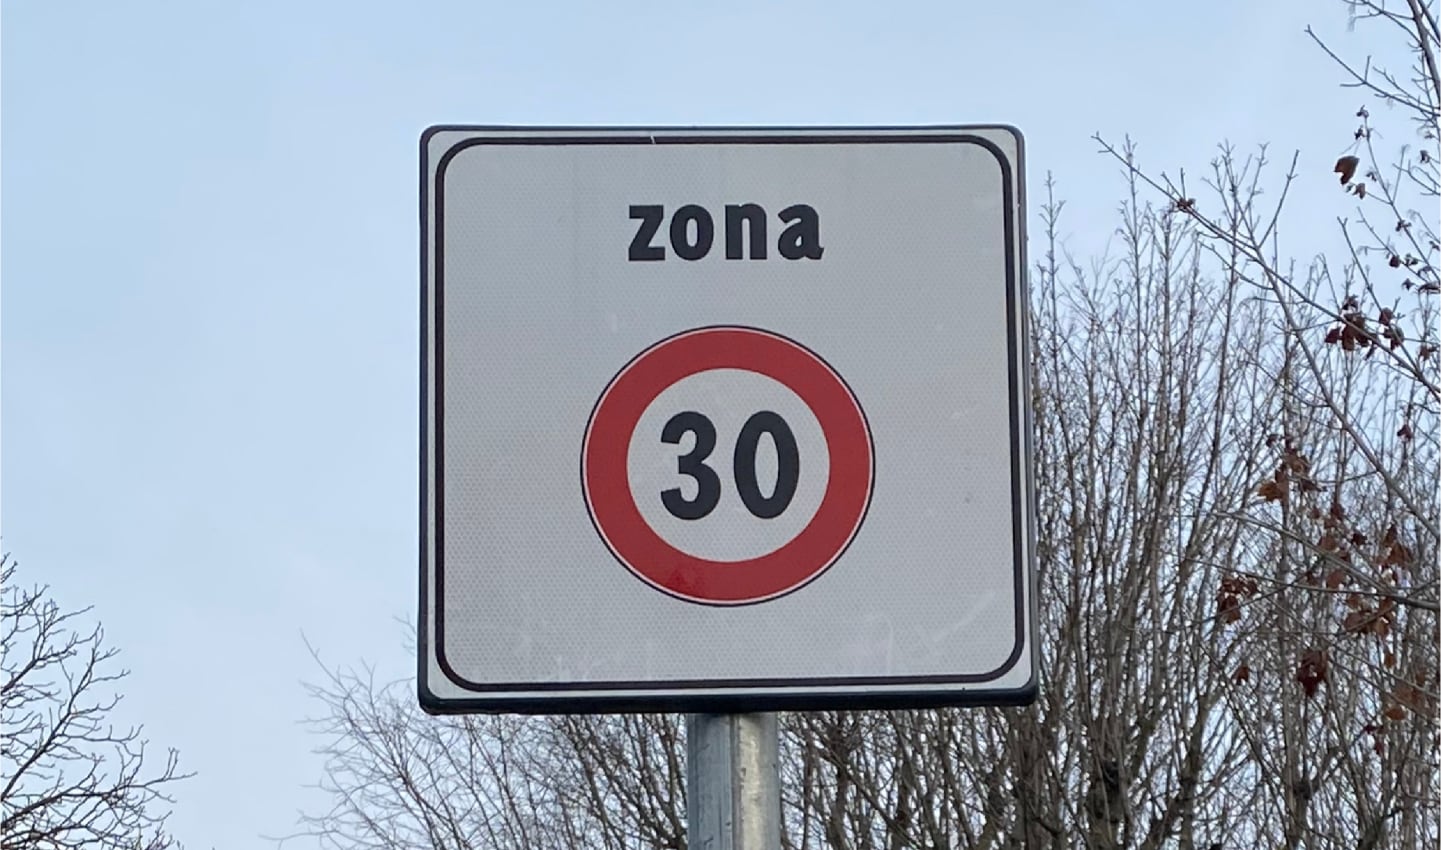
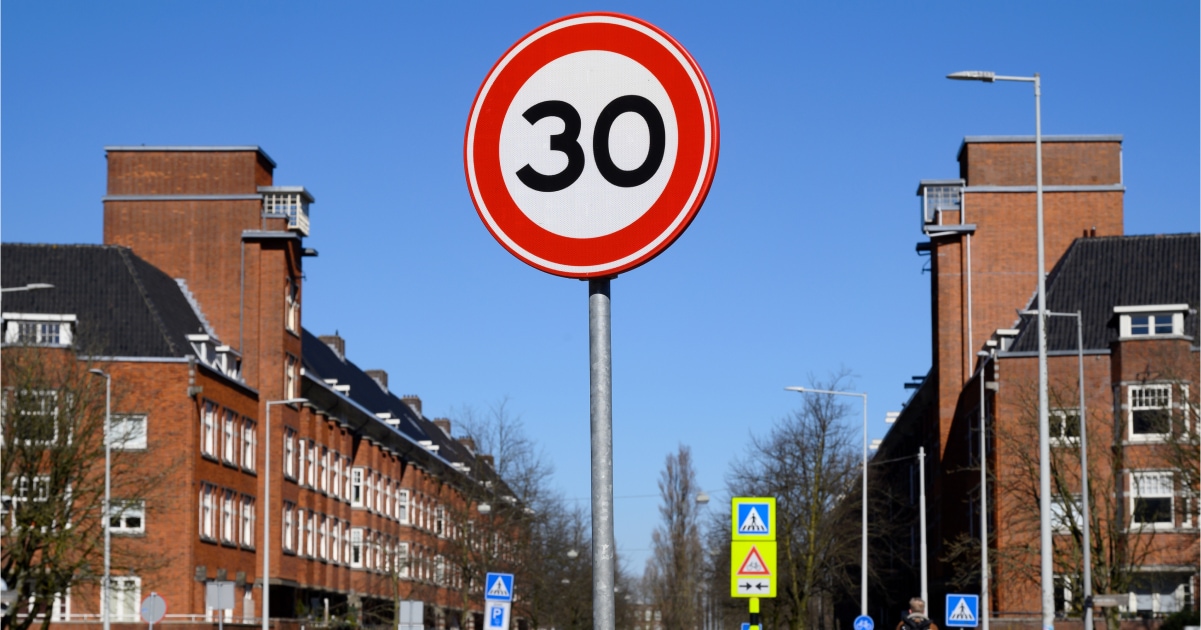
Among the pioneers is Amsterdam, home ground for TomTom and a city renowned for its cycling culture and public-first approach to urban planning. In the 1970s, mass protests opposed the car-centric shift and pressured the government to retain the city's human-centered layout. The legacy of those protests is visible today, as Amsterdam continues to prioritize bike lanes and pedestrian zones, making a bold move in 2023 to reduce speed limits to 30 km/h across 80% of city streets.
Why cities are lowering speed limits
There’s a common thread across the goals and reasons set out by cities for measures such as lower speed limits. Exponential growth in cities leads to complex problems that urban planners and city officials need to solve. How to shape the cities and urban mobility, reduce accidents and enhance quality of life, all while managing the needs of a community — from safe public spaces to ever-important emergency services.
Road safety: A lower speed limit directly translates to a reduced risk of serious injuries or fatalities in the event of a collision.
Noise pollution reduction: Slower speeds lead to less noise generated by vehicles, contributing to a more peaceful and livable city.
Improved livability: The combined effect of safer and quieter streets enhances the overall quality of life for residents.
Promoting sustainable transportation: The lower speed limit encourages the use of cycling and public transport, aligning with broader goals of sustainable mobility. In cities like Amsterdam, it also opens up the possibility of allowing cargo-bikes and newer models of fast e-bikes to use the main roads rather than cycling paths.
Reducing traffic congestion: By encouraging a shift towards more sustainable transportation options, the speed limit can also help to alleviate traffic congestion in some areas.
Results: Numbers that tell a story
The decision to lower speed limits has been met with varied degrees of acceptance from the car users but if you look at why they were set in the first place, there are positive results across almost all cities.
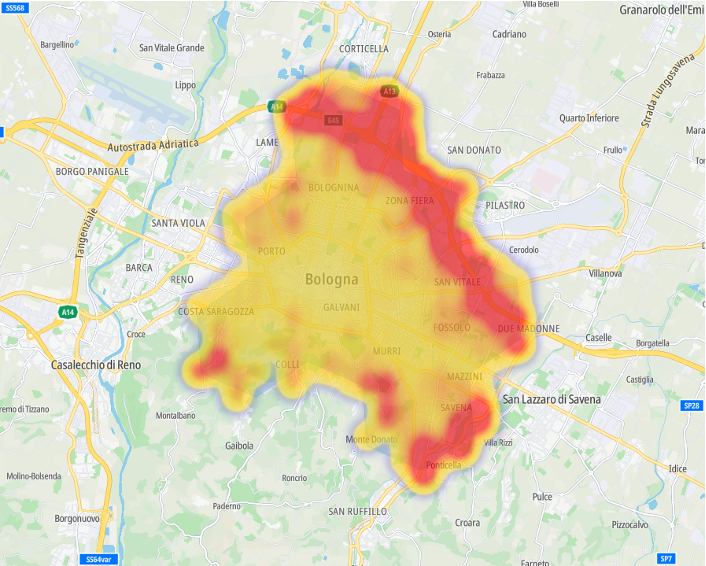
Bologna, Italy
A look into TomTom data showed clear signs of cars driving with reduced speed limits across the city. The reduced speed did not add a lot of extra time for drivers to cross a 10km section of the road. This indicates that though the speed limit may seem like an inconvenience, it does not affect drivers in a major way, but it does have a big impact on the safety and livability of all citizens.
Several independent sources suggest that the goals set out by the cities are being met, thanks to the implementation of speed limits. In Bologna, the urban mobility observatory reported
46% drop in accidents involving injuries (first six months)
Noise levels down by 3-4 decibels in residential neighborhoods
Usage of public transit increased as streets became more accessible
An in-depth analysis on how TomTom data was used to get various insights can be found in this article by transform transport.
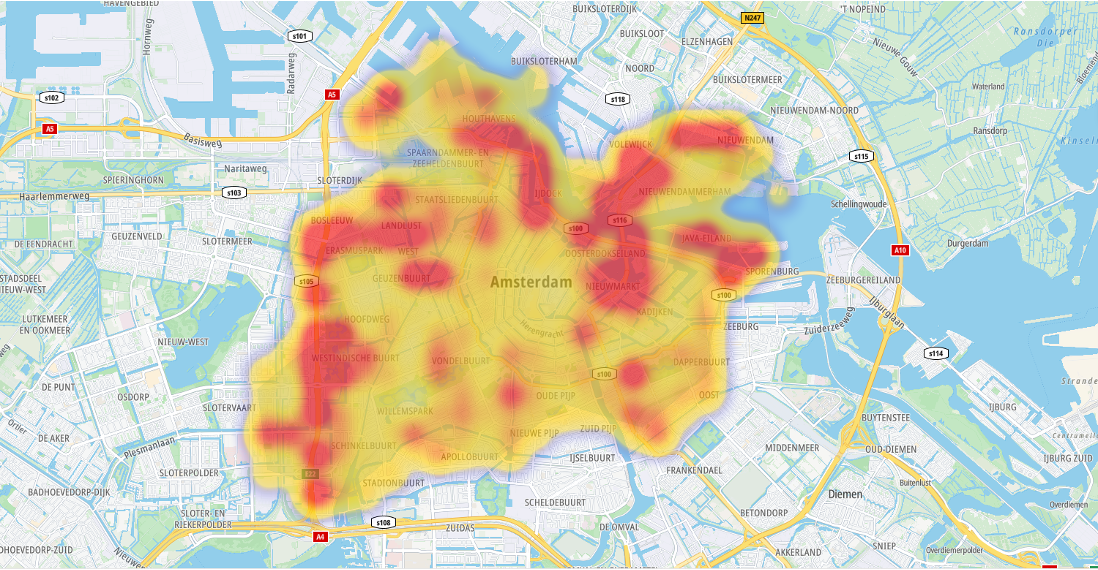
Amsterdam, Netherlands
It’s a somewhat similar story for Amsterdam. While congestion may look like it's increasing, if you look at the impact from a safety point of view, the data tells a different story. Narrow roads across the city show clear signs of speed reduction without too much impact on the travel time. There’s also an increase of congestion on highways as more and more vehicles start opting for faster routes with higher speed limits.
The endeavor to set up the limit across the city and change the infrastructure was an arduous journey. But six months after the new speed limit was implemented on various major streets, Amsterdam officials have reported a notable reduction in vehicle speed, marking progress in the city’s goal to improve road safety and reduce traffic-related incidents. A short survey also showed that a majority of participants are happy about the added safety that it brings to the city. While there are counter arguments about the impact of the speed limits in Amsterdam, city officials expressed optimism about the findings.
A recent report commissioned by Transport of London around the 20kph speed rule claims the rule has reduced the number of deaths and “shows clearly that lowering speeds is saving lives.” Congestion pricing in New York continues to be a talking point even though initial reports suggest that the congestion pricing is successful.
A blueprint for safer, smarter cities
Lower speed limits are a cost-effective and impactful way to redesign cities around people. The evidence is increasingly clear — reducing speeds enhances safety, lowers emissions, enables sustainable transport solutions to thrive and boosts overall public satisfaction.
For mayors and urban planners, these examples offer a compelling roadmap. As TomTom continues to support smart urban mobility, we believe data-driven planning will accelerate the shift toward more resilient, inclusive and livable cities.
People also read
)
Clearer roads, faster trips: The data behind NYC’s congestion pricing success
)
'It's not going to happen overnight' — TomTom expert explains how we can fix congestion
)
Sapporo, Japan sets the record for the single, worst day of traffic in 2024
)
TomTom Traffic Index: Why our approach can't be matched
* Required field. By submitting your contact details to TomTom, you agree that we can contact you about marketing offers, newsletters, or to invite you to webinars and events. We could further personalize the content that you receive via cookies. You can unsubscribe at any time by the link included in our emails. Review our privacy policy. You can also browse our newsletter archive here.