Amsterdam, The Netherlands
Traffic conditions
Amsterdam traffic in 2025
How busy did Amsterdam get during rush hour?
Time lost due to traffic in rush hour in 2025
97 hours = 4 days, 1 hour
3 hours 50 min more than in 2024.
- Major delay
- Minor delay
- No delay
- Closed
-
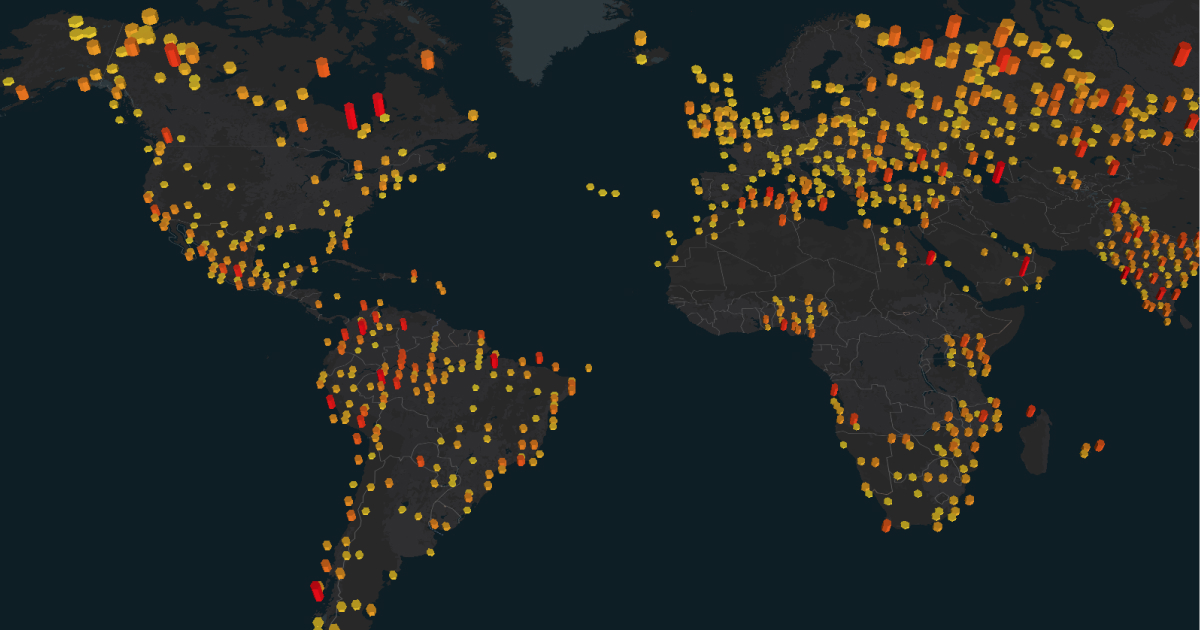
The global traffic challenge in numbers: What the TomTom Traffic Index data tells us
For more than 15 years, the TomTom Traffic Index has monitored the health of our roads, capturing its minute-by-minute pulse to assemble a year-long overview of how vehicles have moved through hundreds of our world’s major cities. This year’s edition tells a painfully familiar story. As cities grow and journeys multiply, the challenge of managing city road networks continues to loom over municipalities, town planners and transit authorities. The Traffic Index confirms that keeping traffic moving has never been more difficult. How can we keep tackling such a challenge? With data, lots of data.
More details
-

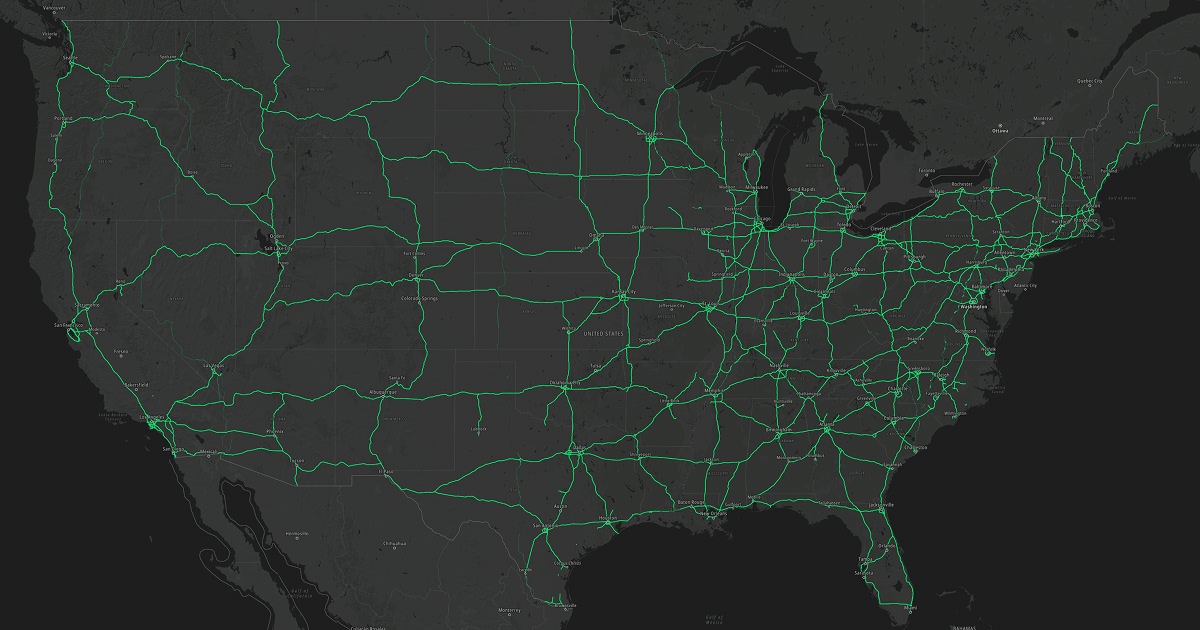
Building road network resilience: How to keep moving through disruption
Transport networks are the complex circulatory systems of our cities, states and countries. When working well, they enable the economy, social connection and the movement of goods and services. But when a sudden disruption hits, whether it’s a flash flood, major event or infrastructure failure, these same systems can rapidly become a source of difficulty. Congestion escalates as mobility becomes most urgent, freight delays spread across supply chains and emergency vehicles struggle to reach people who need help most.
More details
-
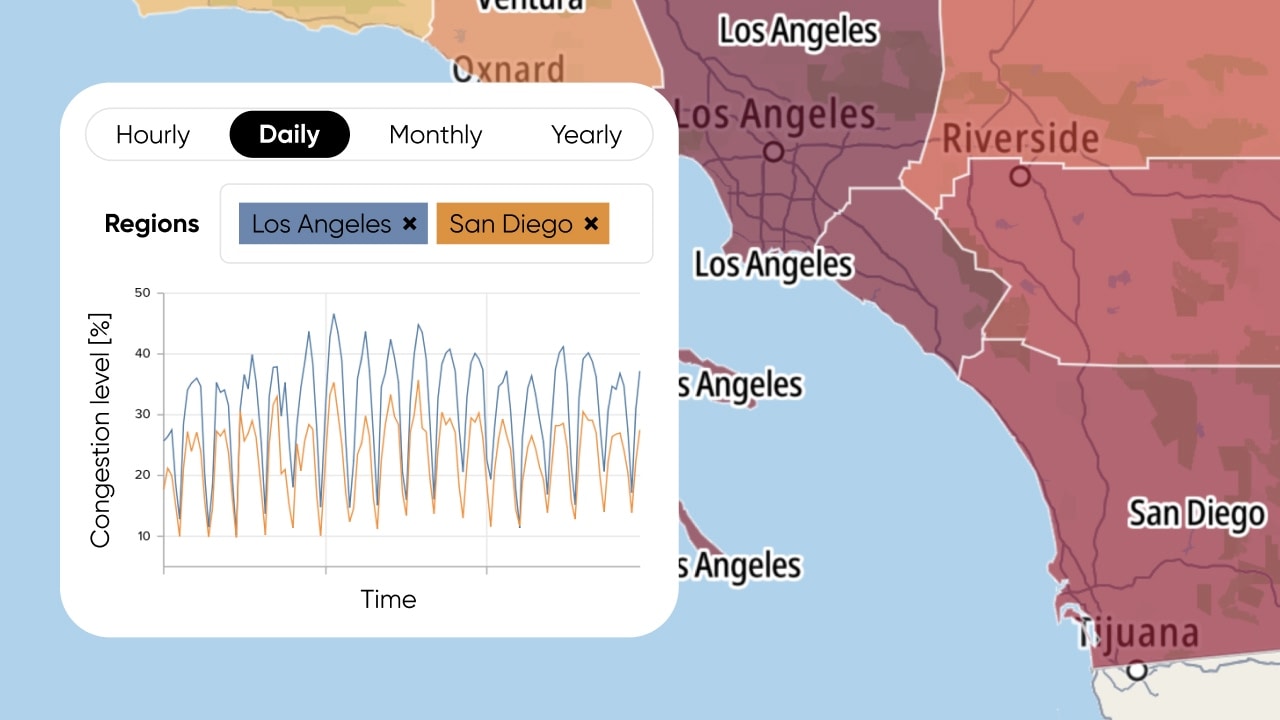
Roads to efficiency: Data-driven transport planning in New York, Texas and California
Transportation gives our cities life, enabling people and goods to flow through increasingly complex urban environments. But in the past decade, congestion has intensified across the United States. It’s getting harder to predict and more expensive to leave unchecked. At the same time, cities, governments and planners now have access to smarter, data-driven tools to manage today’s rising mobility challenges.
More details
Shape your strategy with world-leading data
TomTom's suite of tools and services turn traffic data into valuable, actionable insights.
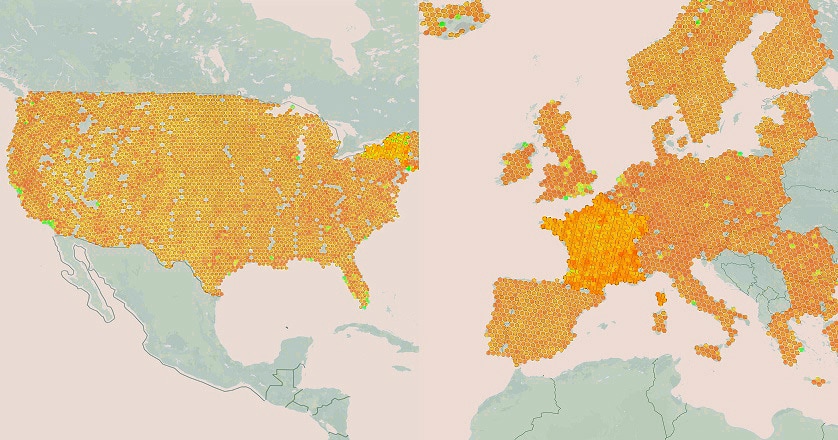
Insights that know no bounds
Download ready-to-go reports or draw your own conclusions with TomTom's Area Analytics tool.
From global trends to local insights: Traffic Index and Area Analytics in action
TomTom experts will unpack how congestion, travel times and speeds evolved across major cities in 2026.
-
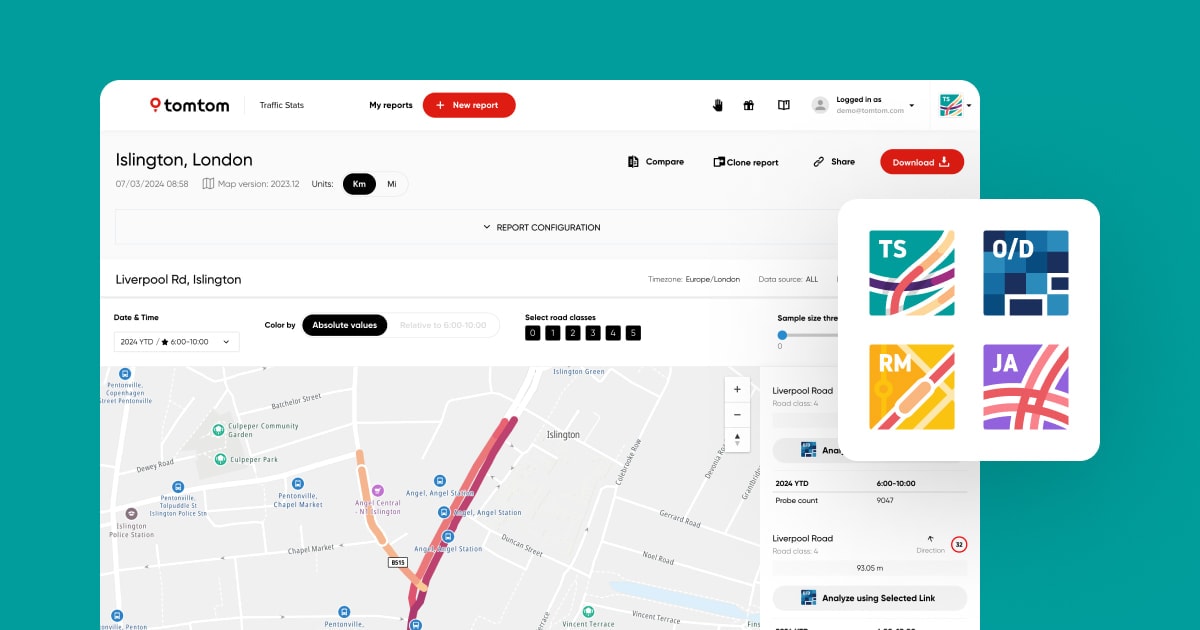
Traffic analytics
TomTom MOVE
Ready-to-use reports and data visualizations from our analytics tools.
Learn more →
-
Product
Traffic Stats
Understand, predict and reduce congestion.
Learn more →
-
Solution
Government and public sector
Enhance citizen safety and support sustainable urban growth.
Learn more →
-
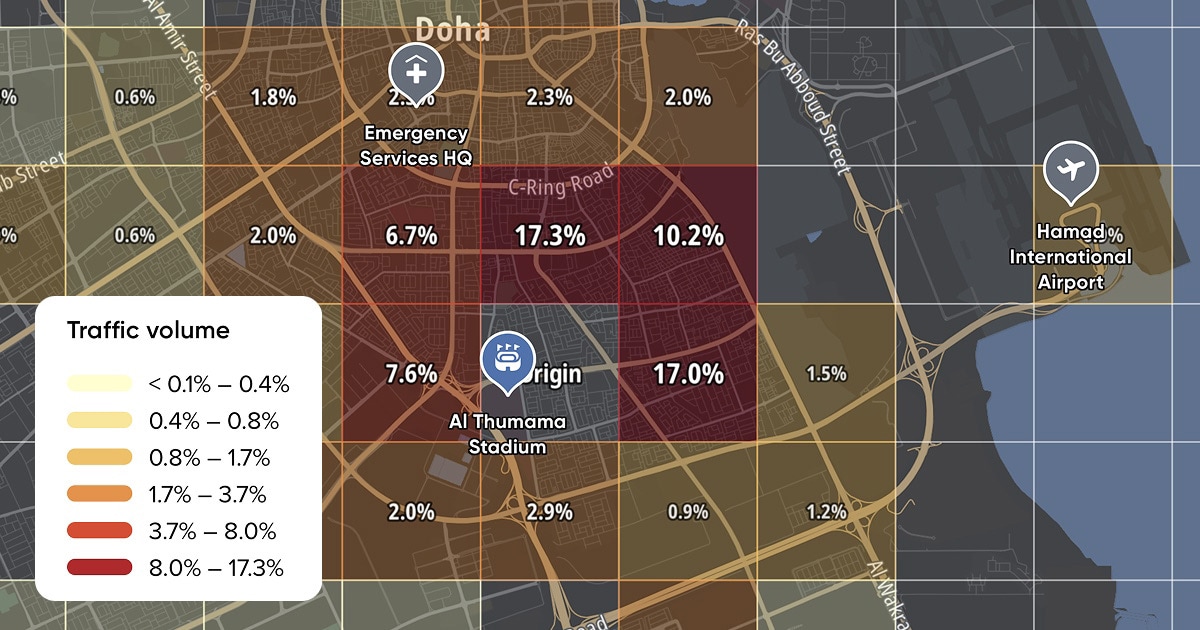
Demo
Smart mobility planning for big events
City planners use traffic insights to keep traffic moving around a big sporting event.
Start demo →
Let’s change the way the world moves!
Decision-shaping data for traffic engineers, policy leaders and transport planners.
-

Make your own reports in seconds
Use our web portal to access reports with ready-to-use data visualizations and download the results for your own custom analysis.
Get 30 days free →
-

Get in touch
We help your cities, cars or policies tackle traffic better. Leave your details and we’ll get in touch.
Contact us →

