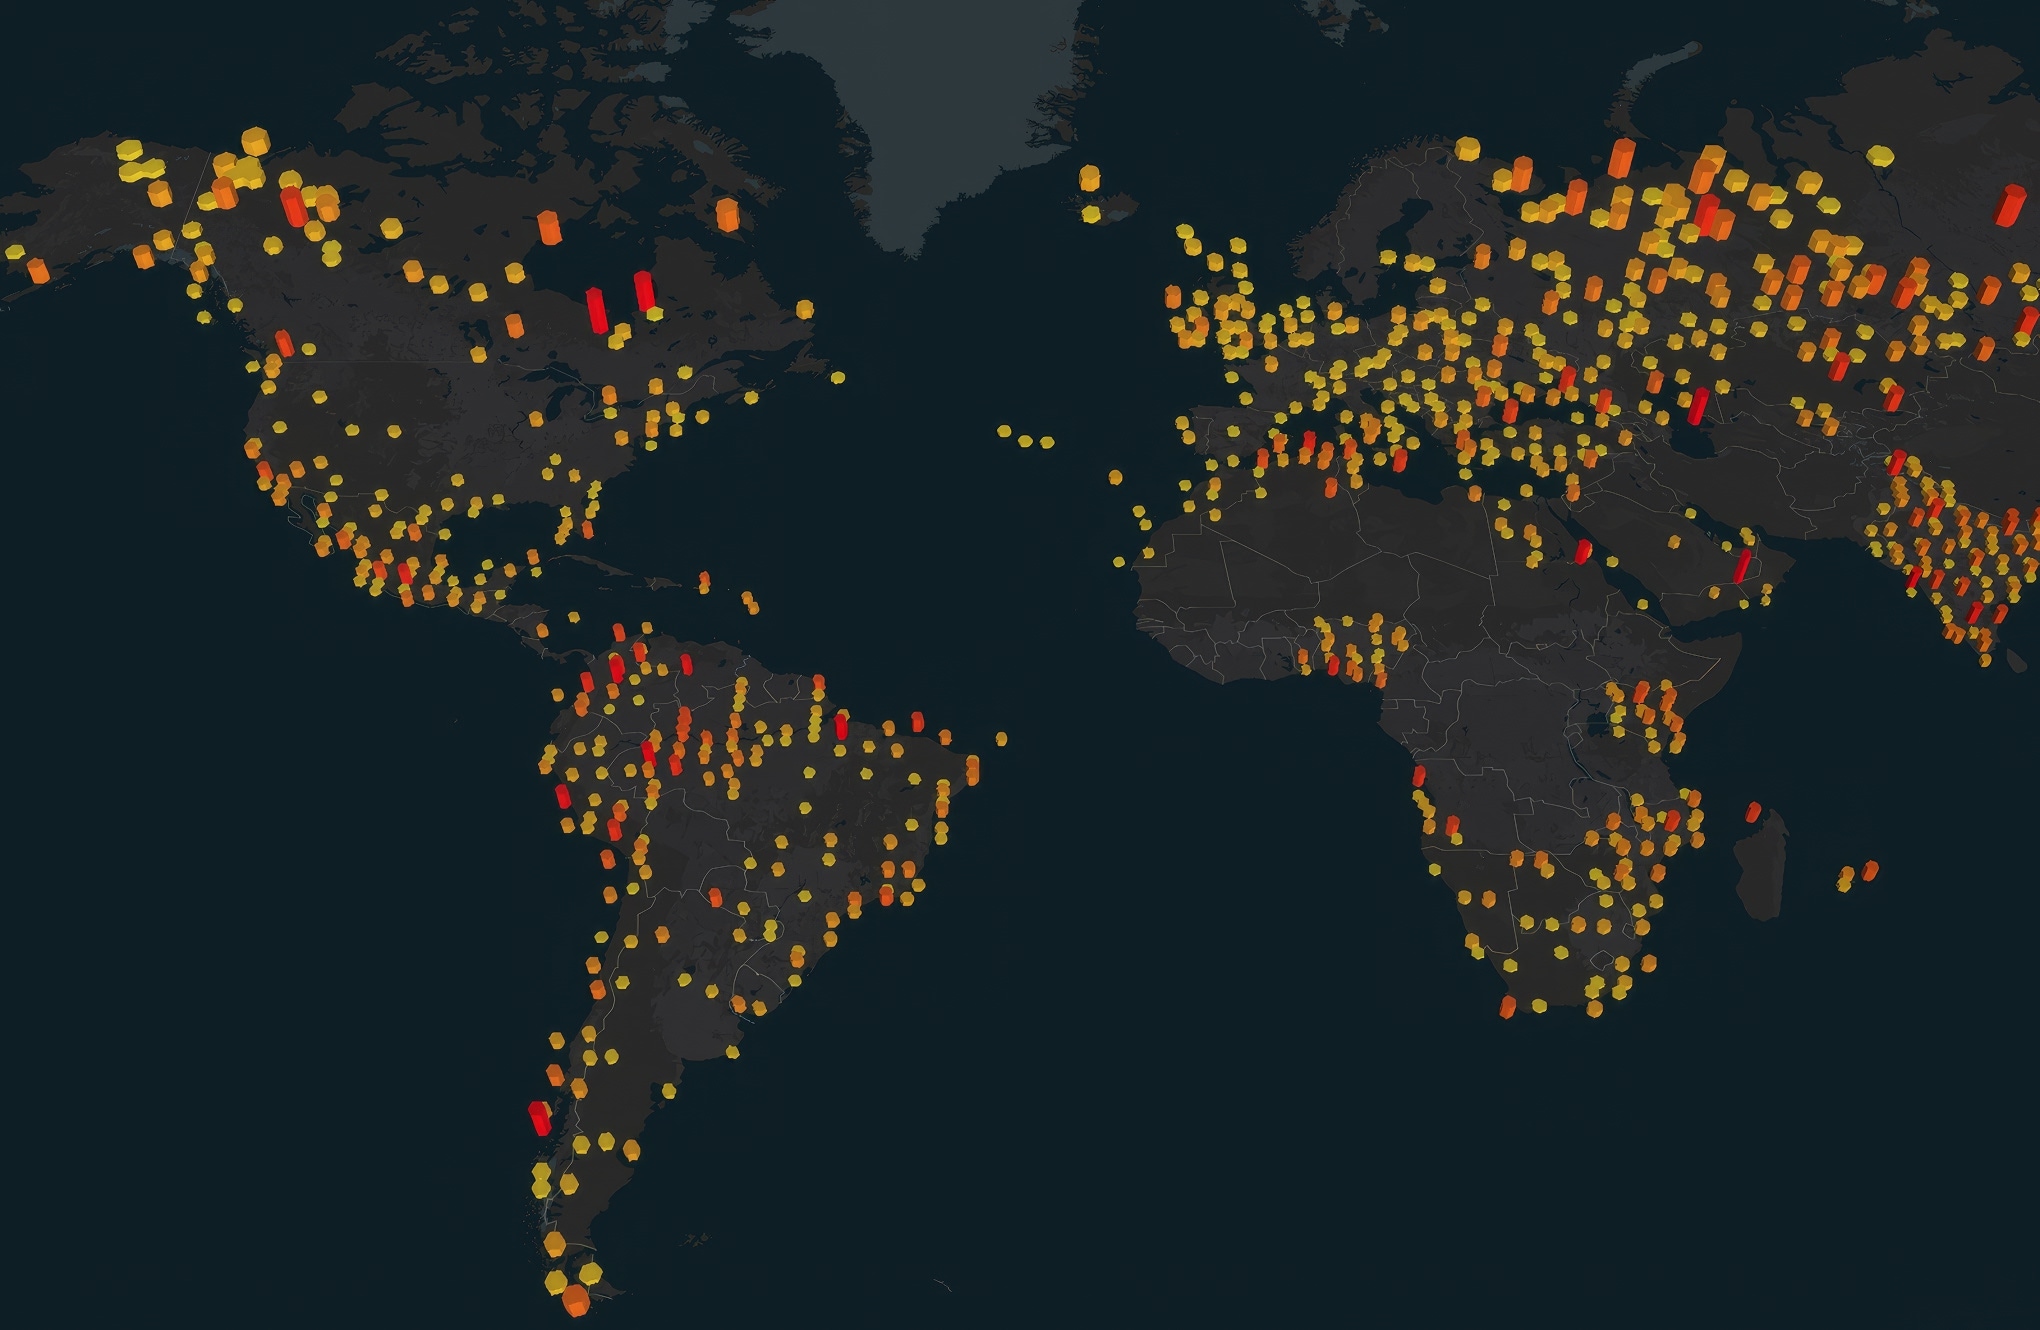
A world map with scattered yellow and red dots indicating data points across various regions, on a dark background.

WEBINAR February 11, 2026 – 11am CET

From global trends to local insights: Traffic Index and Area Analytics in action (Europe focus)

This webinar focuses on use cases from Europe. If you’d like to see use cases from the U.S. and Canada, click here to join our U.S. and Canada webinar.

Every year, the TomTom Traffic Index illustrates how global mobility changed over the past year. But did you know you can zoom in on global trends and extract insights from any area relevant to you — whether state spanning or street specific?

Join our next webinar, where TomTom experts will unpack how congestion, travel times and speeds evolved across major cities in 2026. Next, they’ll show you how our advanced Area Analytics tool can help you apply these insights to custom areas ranging from a single corridor to multiple regions — so you can pinpoint problems, compare changes over time and evaluate the impact of your interventions. You’ll also see real-world use cases of traffic and mobility teams using these tools to optimize investments, improve safety and design more resilient, livable cities.

Agenda


Our experts will cover these topics in a 60-minute session and answer any questions you have.

  • Introduction

  • Highlights from Traffic Index 2026

  • Introducing Area Analytics

  • Use cases and customer stories

  • How you can get started

  • Q&A

Presenters
Sandra Zialcita

Sandra Zialcita

Corporate Communications Manager, TomTom

Andy Marchant Presenter

Andy Marchant

Director of Product Marketing, TomTom

Jarmila Kaiser

Jarmila Kaiser

Product Manager, TTI Traffic Analytics, TomTom