Solutions
Demo
Related content
Split aerial view of city zones with a chart showing loss frequency rate decreased from 4.1 to 3.2 in high exposure area Zone C.

Territory risk assessment for auto insurance

Automotive territory risk scores are only as good as the data behind them. TomTom map and traffic data help insurers assess risk by census tract, ZIP code or road segment. They combine traffic volumes, speed patterns and road details gathered from hundreds of millions of connected devices, so you can keep risk calculations up to date and base them on how vehicles are actually used.

Getting started is simple. In just a few minutes, you can: use data samples and TomTom docs, get the notebook from GitHub or get hands-on in Databricks.

Solutions

Make an impact with TomTom tech

Insurers writing more than $10 billion in direct premiums every year use TomTom map and traffic data to power their risk and underwriting models. Here’s how it can sharpen your territory risk scoring.

Get to granular risk scores

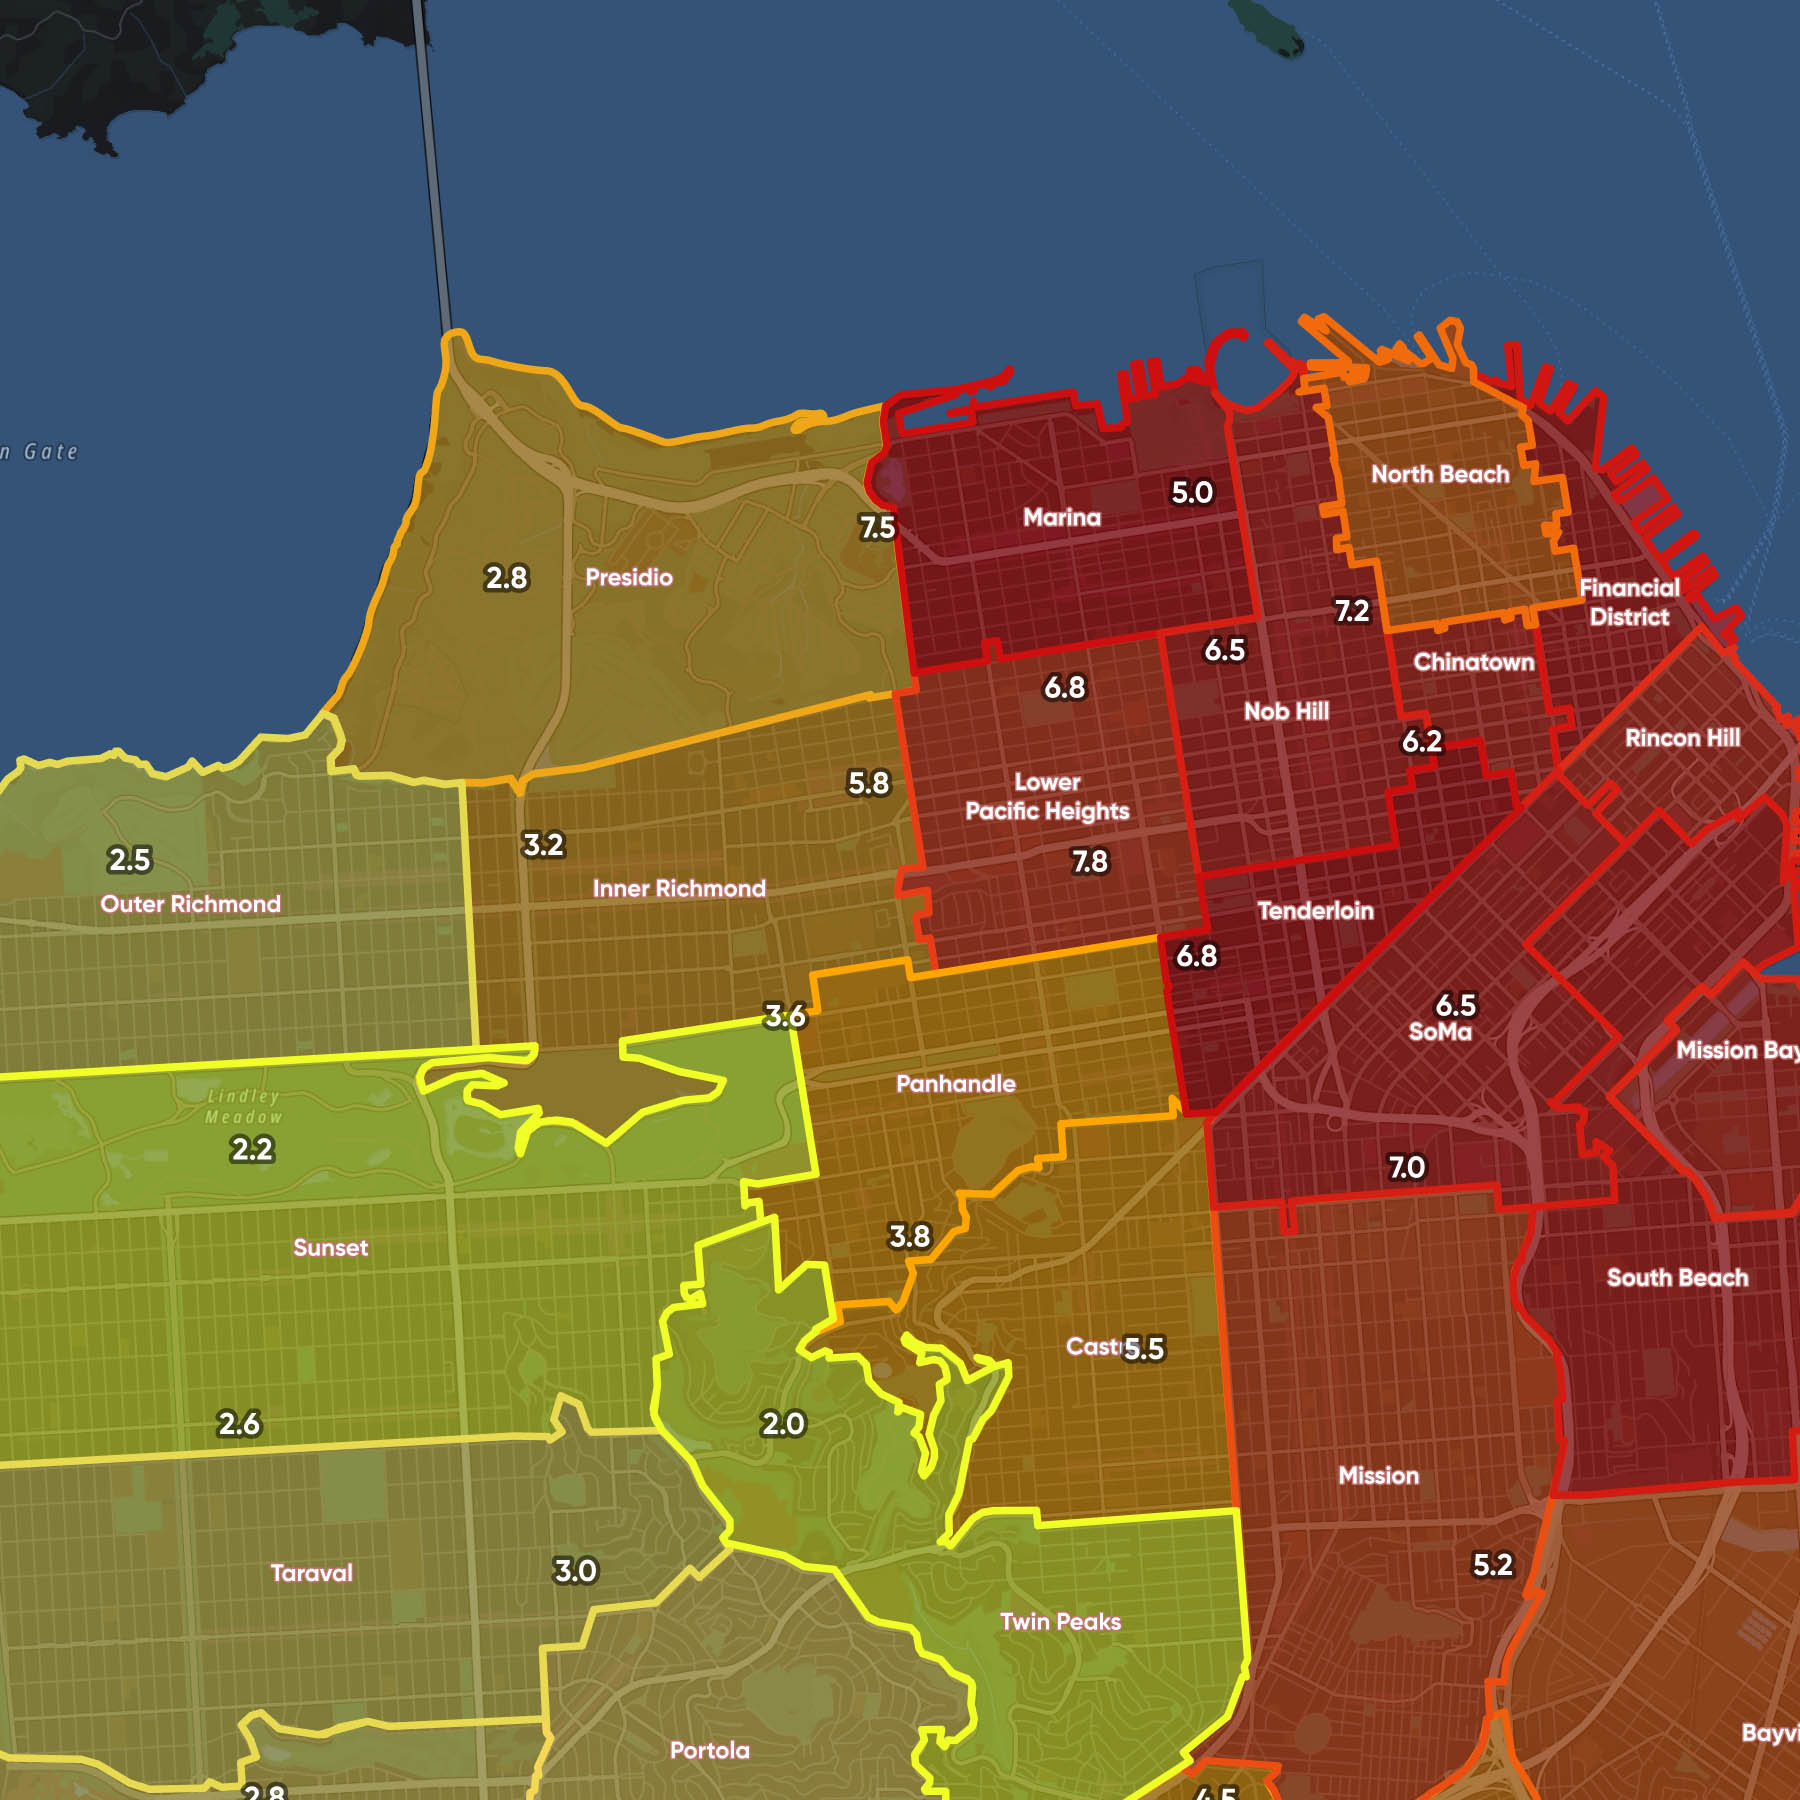
Most territory ratings stop at the ZIP code or census-block level. But not every road in that area carries the same risk. TomTom data helps risk models go deeper, with traffic volumes, speed limits, speed patterns, lane counts and road network details for every road segment. You can aggregate that traffic and map data up to the boundary you rate on. When two neighborhoods in the same ZIP code carry different levels of risk, your pricing will reflect it.

Map of San Francisco neighborhoods with color-coded regions indicating different numeric values, ranging from 2.0 to 8.0.

Dynamic risk scoring

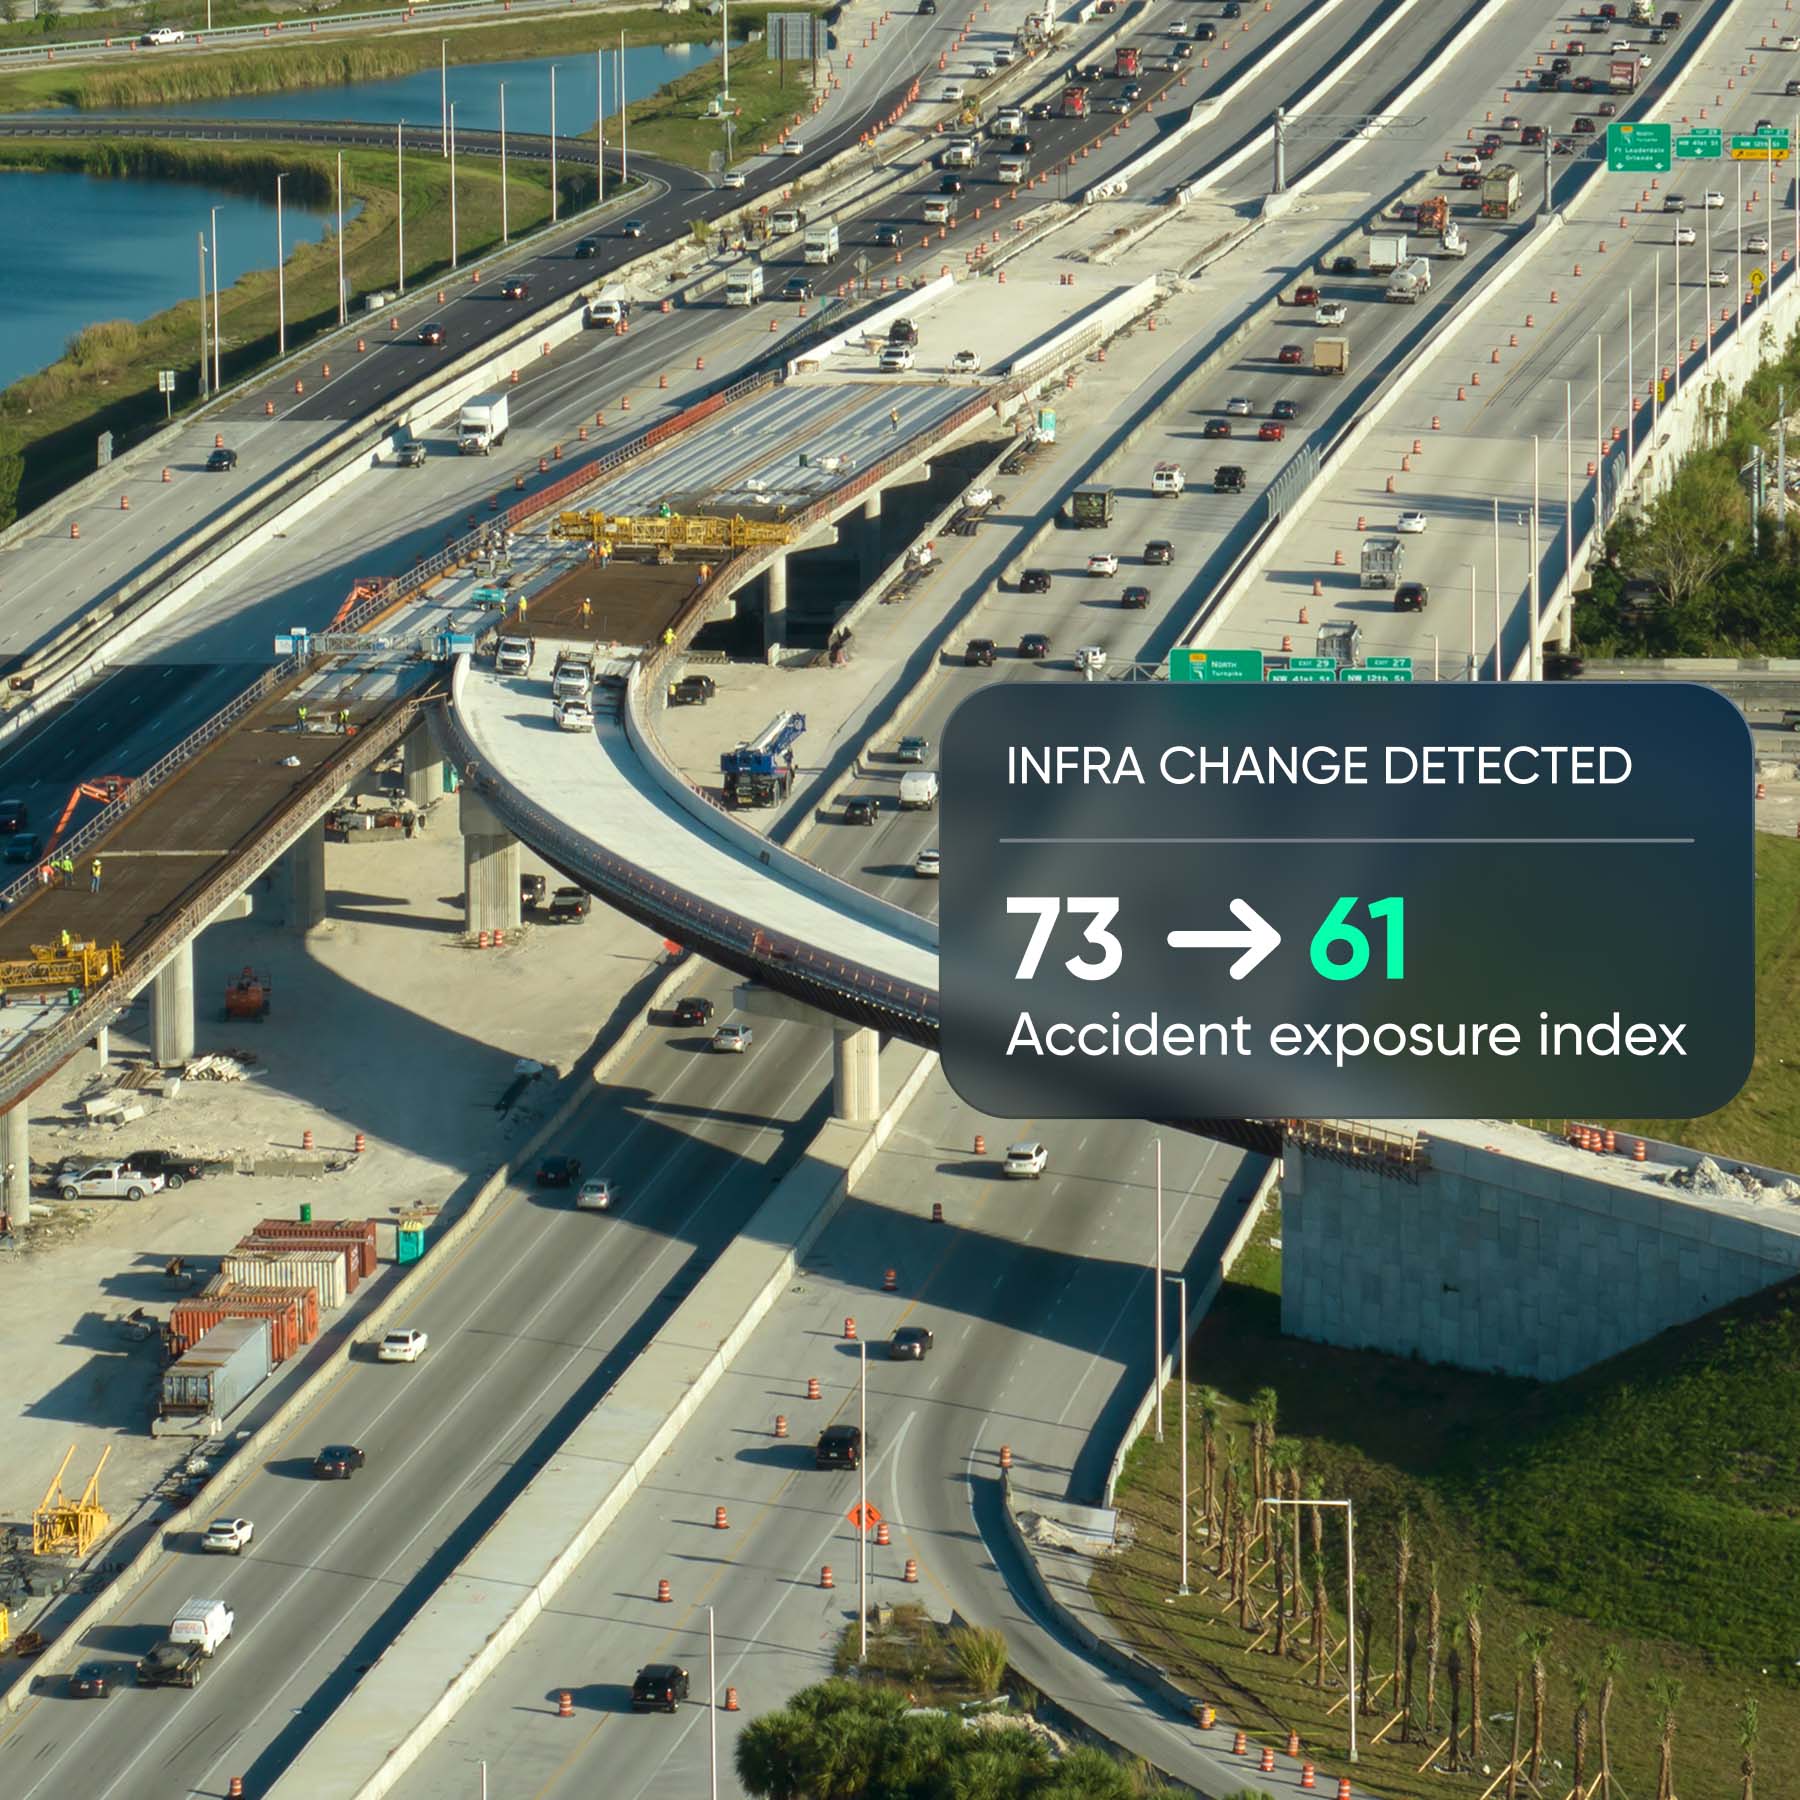
Territory risk does not stay still; static risk tables age fast. New highway exits, added lanes, rezoned commercial areas and changing speed limits can shift the risk profile of a territory long before the next annual rate filing. TomTom maps update as often as every 15 minutes with traffic and movement observations from hundreds of millions of connected devices. You can refresh territory scores weekly, monthly or quarterly, catch risk drift earlier and update your models before changes impact your claims.

Aerial view of a highway with ongoing construction and visible traffic flow. A graphic shows an accident exposure index change from 73 to 61.

Link your own data quickly

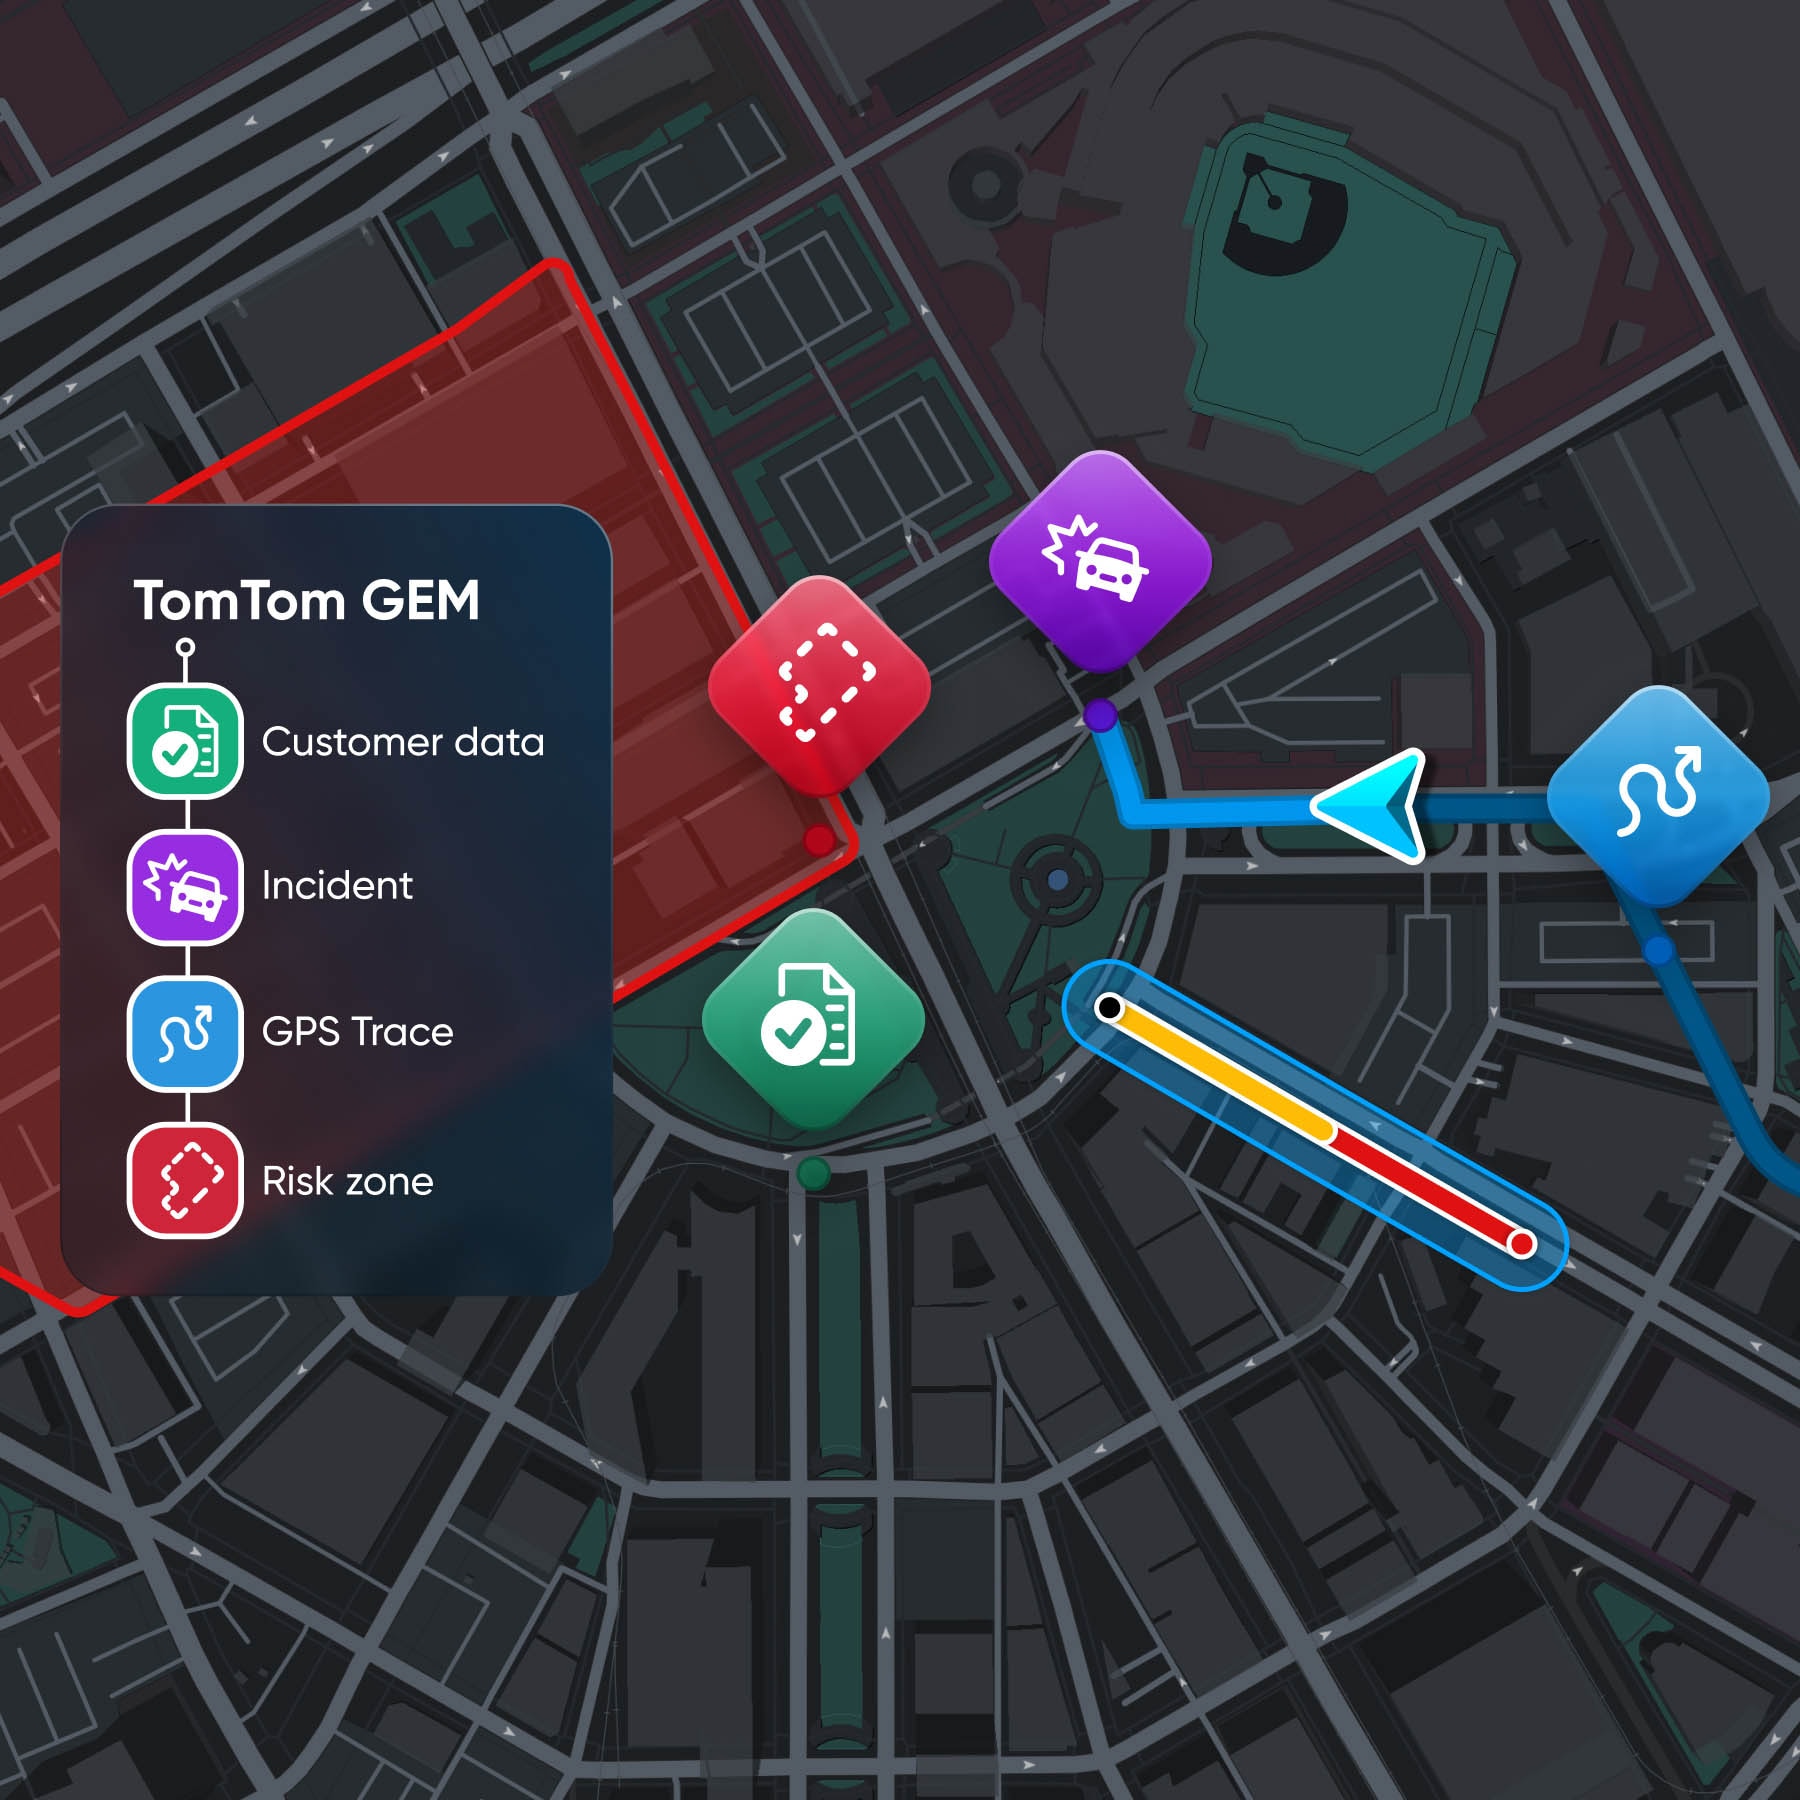
Your accident history, claims data and telematics are your competitive edge. But matching them to a map by hand is slow and easy to get wrong. TomTom Global Entity Matcher (GEM) does that work for you, using AI to align your proprietary datasets to stable location (GERS) IDs with sub-segment precision, even as the real world changes. Add a data source once and it stays linked through every map update and every model version.

A digital map highlighting customer data, incidents, GPS traces, and risk zones with colorful icons and a route overlay.

Get started with us

documentation icon

Documentation

Find API and SDK documentation and tutorials.

Learn more
databricks

Databricks

Load TomTom data samples into your workspace and get started with ready-to-run notebooks.

View on Databricks Marketplace
github

Github

Explore the GitHub repo with notebooks and code examples.

Take me there

Product demo

Building better territory risk models

Explore how insurers use TomTom data to identify high-risk areas and streamline data integration for smarter, stronger pricing. 

New York, USA

Building better territory risk models

TomTom helps insurers go beyond static postcode-based risk models by bringing in road, traffic and driving environment data to create more precise territory risk scores.

In this scenario, we’ll explore how insurers can use TomTom data to identify high-risk areas and streamline data integration for smarter pricing.

.

.

Related resources

Webinar
TomTom and Pinnacle

Smarter data, better pricing: Enhancing auto insurance risk assessment with location and traffic data

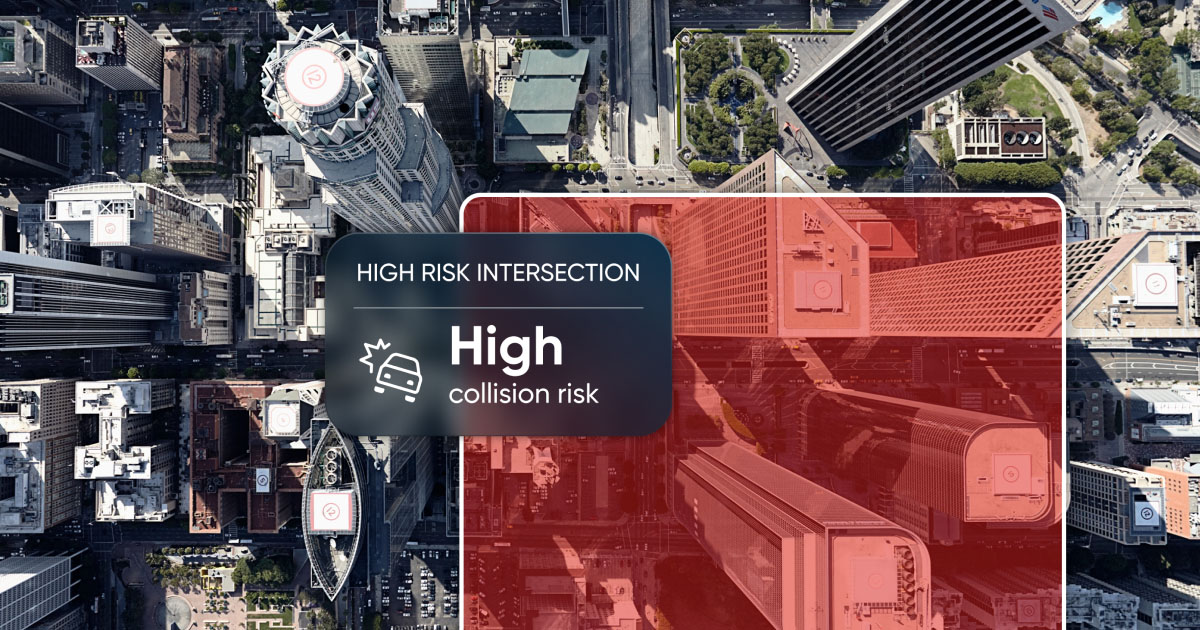
Aerial view of a city intersection marked by a warning overlay indicating "High collision risk" at a high-risk intersection, with the TomTom logo prominently displayed.

Do you have any questions for us?

Tell us what you're building and we'll connect you with the right expert. From data questions and PoC guidance to larger samples and access options, we're here to help you move your project forward.