)
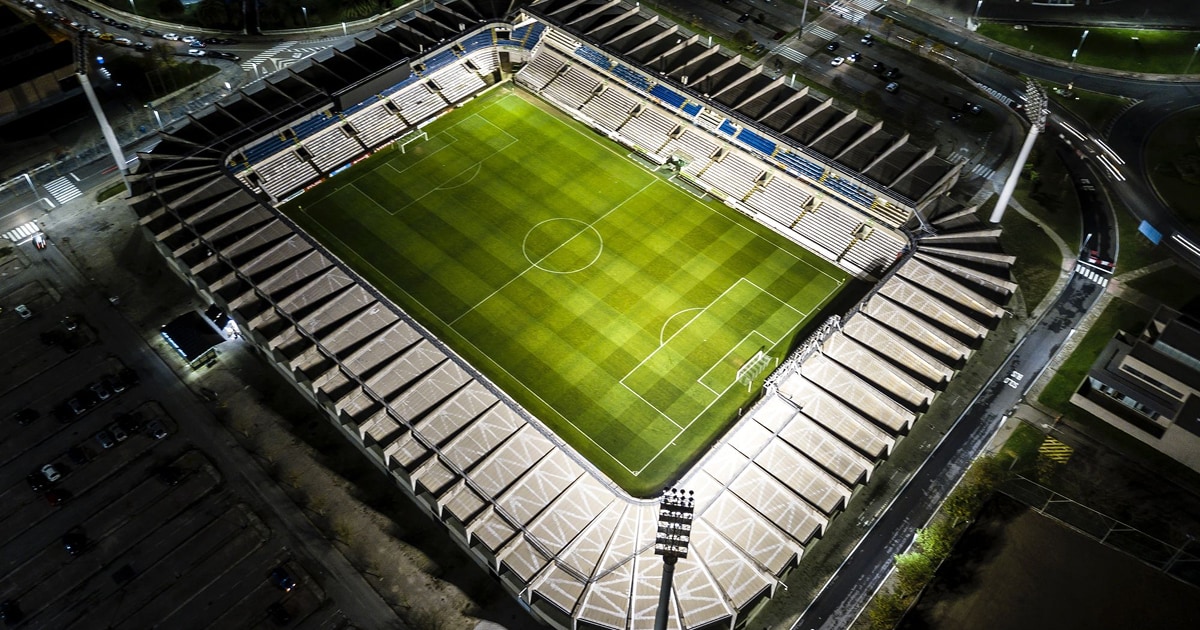
How does traffic change around a football stadium while comparing a match VS a non-match day?
How-to explanation
Big events, such as football matches or city marathons, for sure have an impact on traffic. But how big and where is the impact?
By using Traffic Stats we will create 2 Area Analysis reports around a football stadium in Germany. The area of the 2 reports will be exactly the same. The main difference between the reports will be the date range definition: one report is a match day (February 29th, 2020) and the other is a non-match day (March 7th, 2020).
To create to reports with the same area, we have two options:
After defining the area in the first report, save the area as a template (Figure 1);
Finalize the first report and, once the results are available in the “My Reports” section, clone the report (Figure 2).
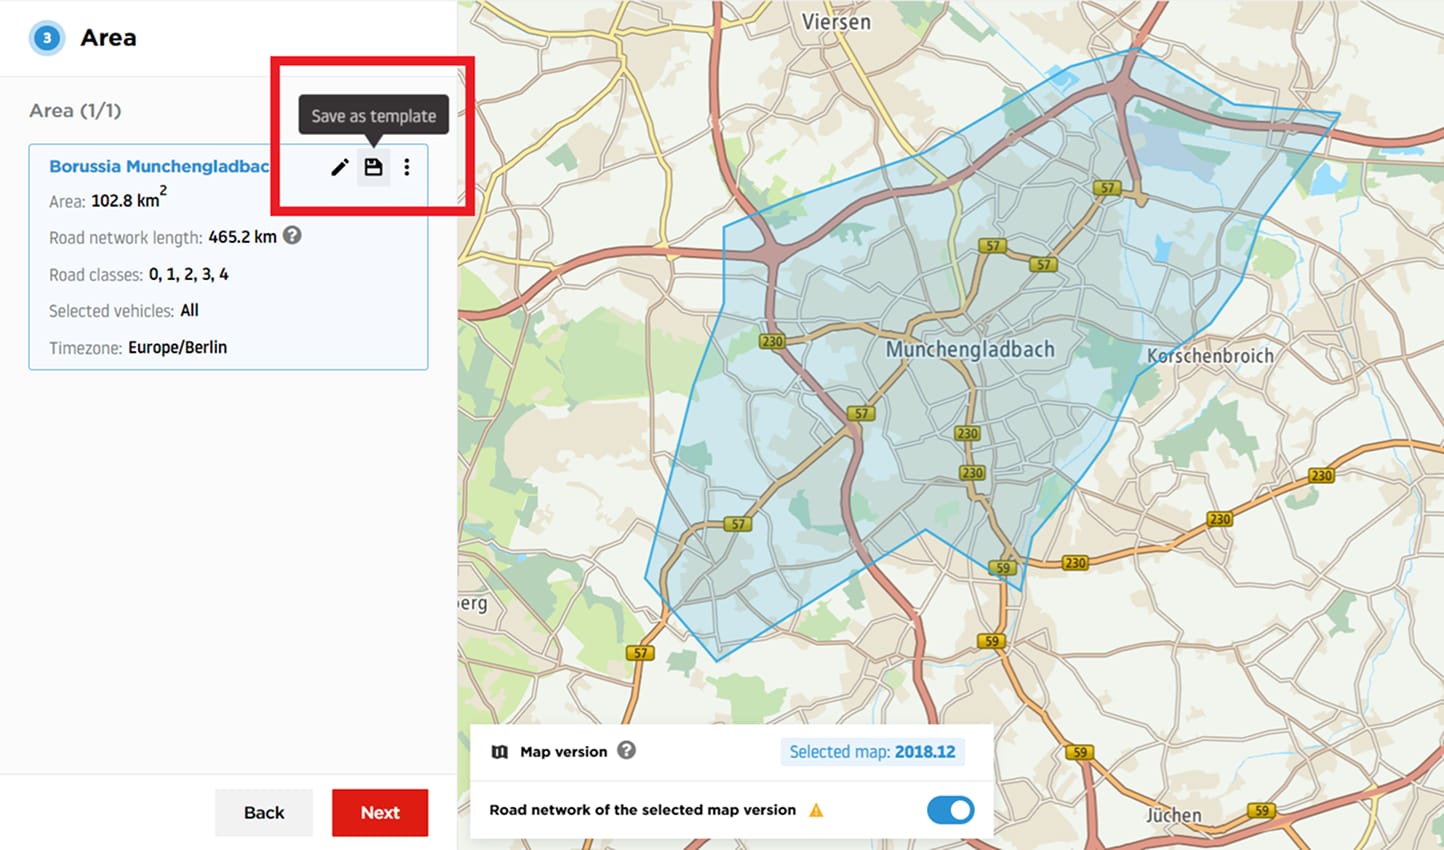 Figure 1: Saving an area as a template.
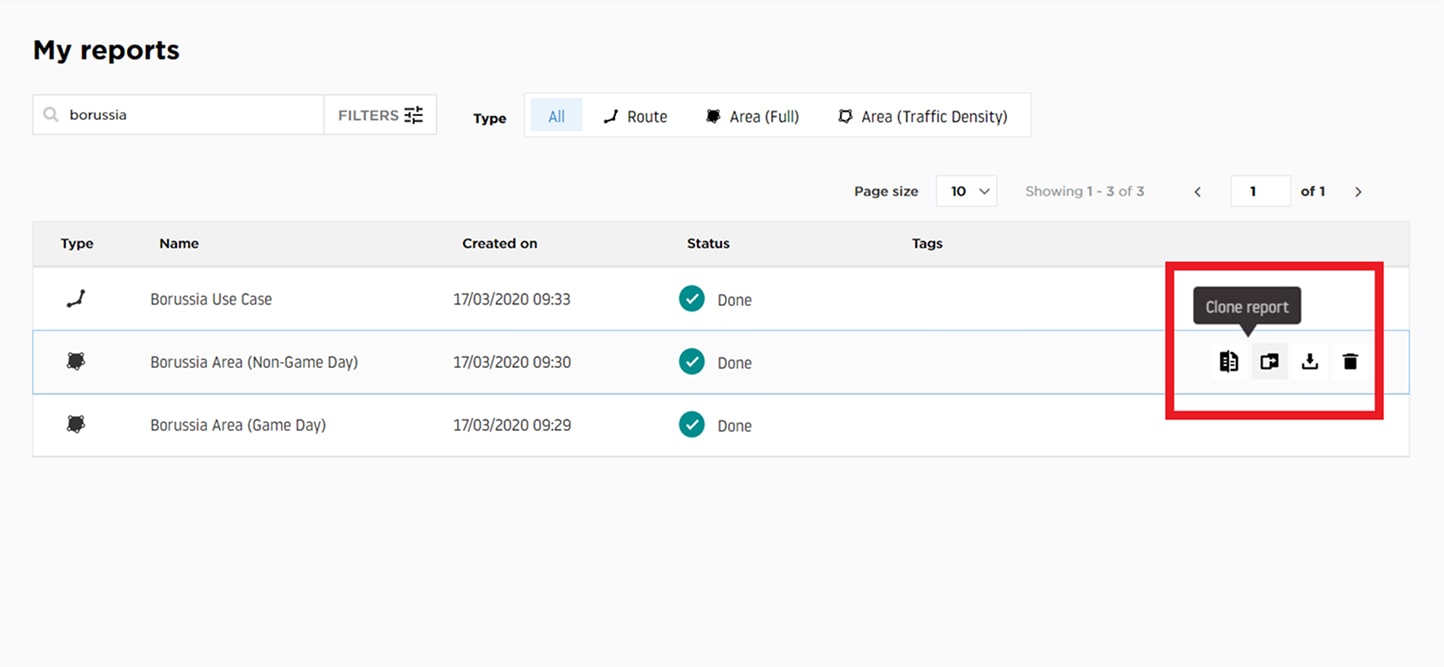 Figure 2: Cloning an existing report.
Both reports will be one-day-only analysis, one being the day of a football match and the other being a regular non-match day (Figure 3 and 4).
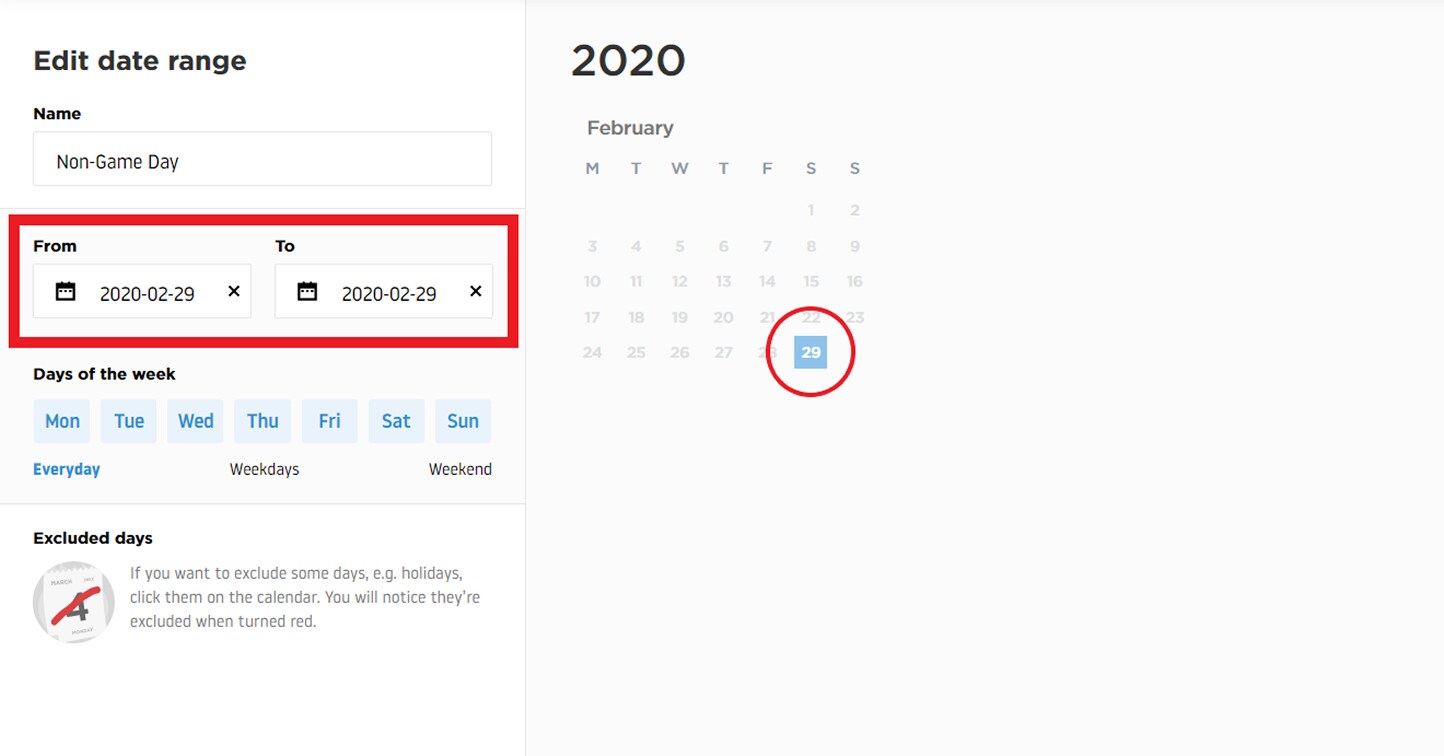 Figure 3: Match day date range definition.
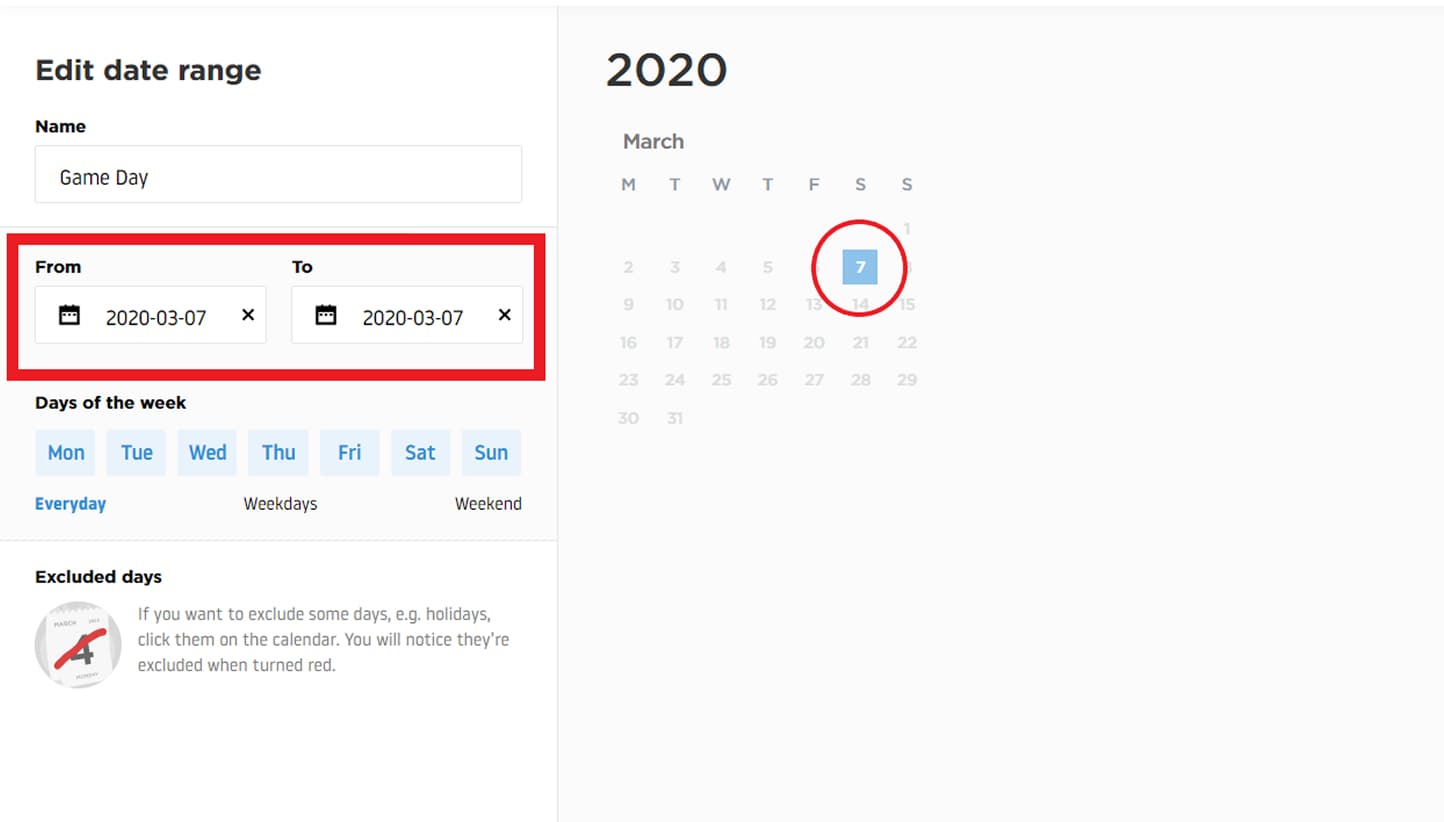 Figure 4: Non-match day date range definition.
Reading the results
Once the 2 reports are finished and available in the “My reports” section, we will use the “Compare report” feature available for all Area Analysis with same area definition (Figure 5). This will allow us to overlay the 2 area results and visually identify the roads performing best or worse.
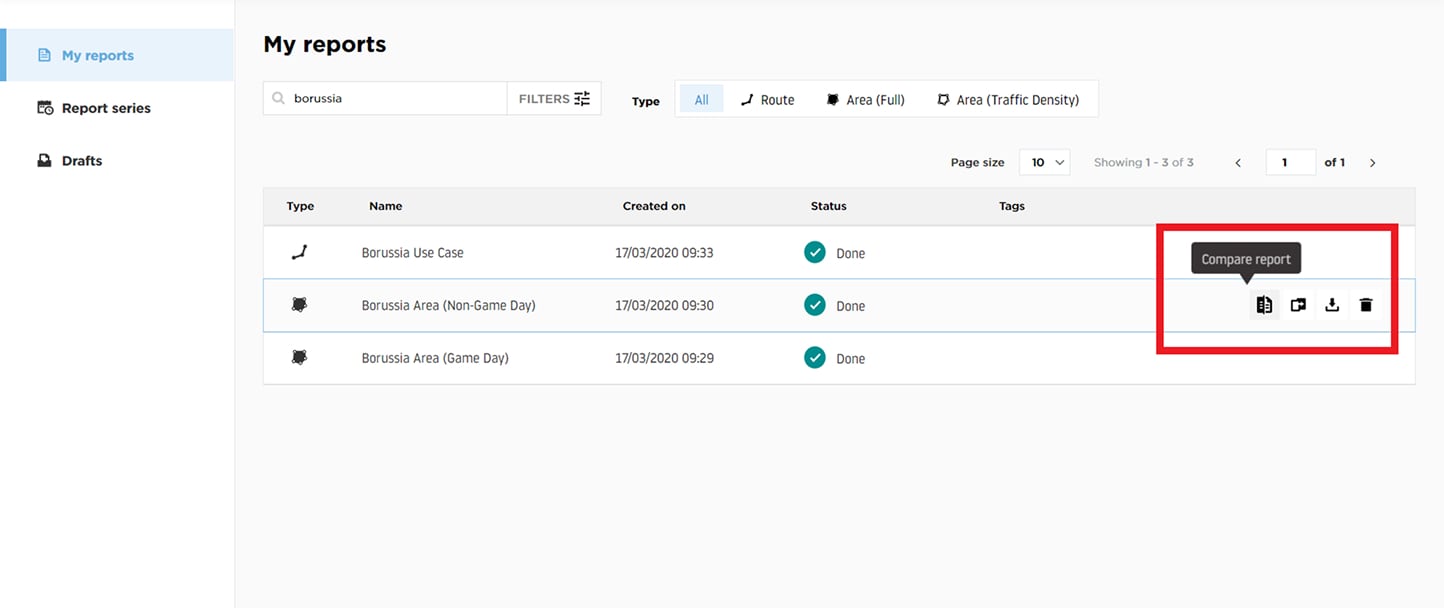 Figure 5: Compare reports option.
Conclusion
By analyzing the 2 reports comparison, it’s clearly visible that, during a match day, the streets around the stadium performs badly when it comes to average speed and travel time (Figure 6).
By downloading the data of both reports, you can easily identify the pain points and bottle necks. According to initiative around events and traffic management, a clear traffic guideline can be created with suggestion of alternative access, load balancing among several parking lots and also incentives for different times of arrival.
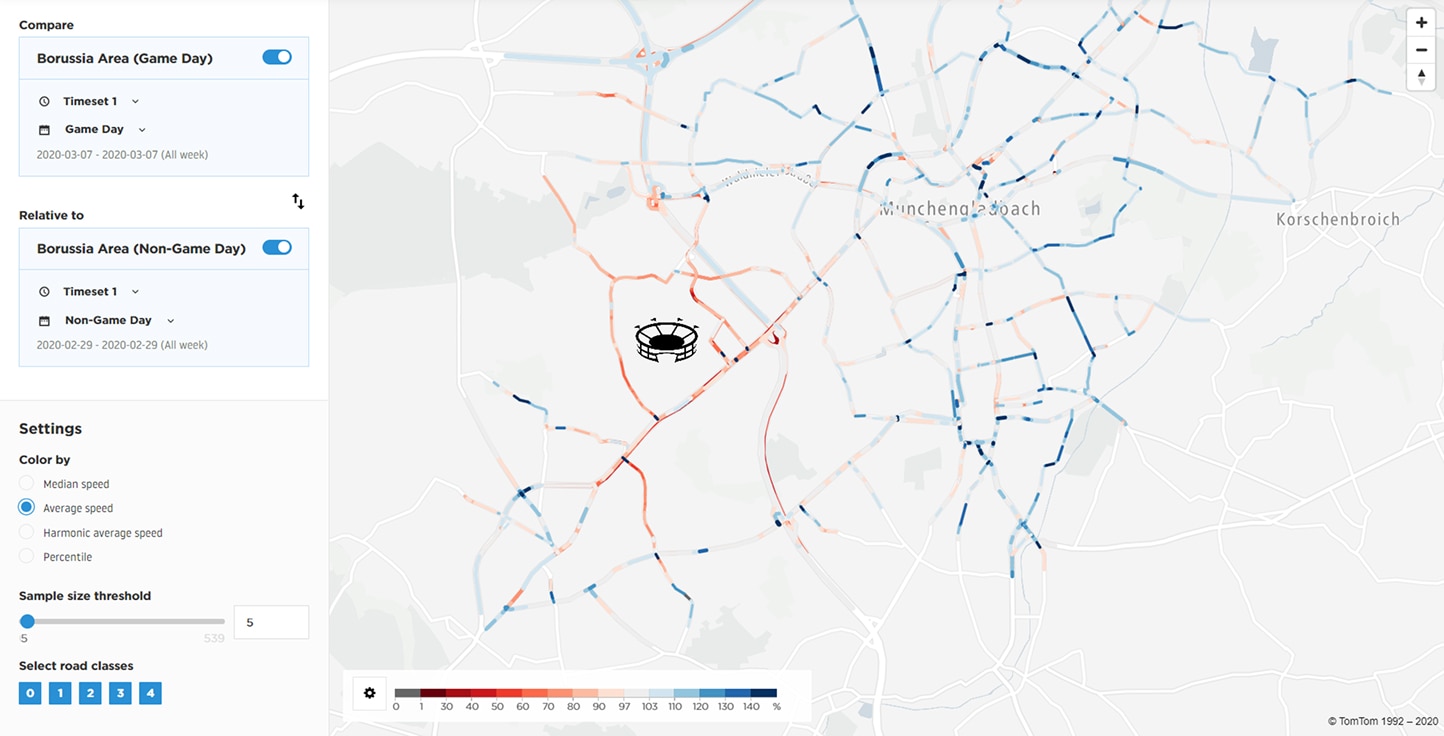 Figure 6: Average speed comparison around the stadium.
People also read
)
DXB Airport & Covid: Traffic insights with our analytics tool
)
Understand travel modes with O/D Analysis
)
Inside TomTom's Traffic products: Traffic Stats
)
Unlock business insights with traffic data and spatial analysis
* Required field. By submitting your contact details to TomTom, you agree that we can contact you about marketing offers, newsletters, or to invite you to webinars and events. We could further personalize the content that you receive via cookies. You can unsubscribe at any time by the link included in our emails. Review our privacy policy. You can also browse our newsletter archive here.