)

How the Dubai International Airport (DXB) volume of trips was affected by the Covid-19 quarantine measures?
How-to explanation
In very attractive areas, such as the DXB Airport, the origin of the trips is not as relevant as the focused destination. With the current Covid-19 crisis, the tourism industry being directly affected, the volume of trips to airports around the world all went significantly down.
Therefore, our focus region will be one only polygon: the DXB International Airport. In order to understand the progress of the quarantine measures, we will do a monthly comparison between January and April 2020 (Figure 1).
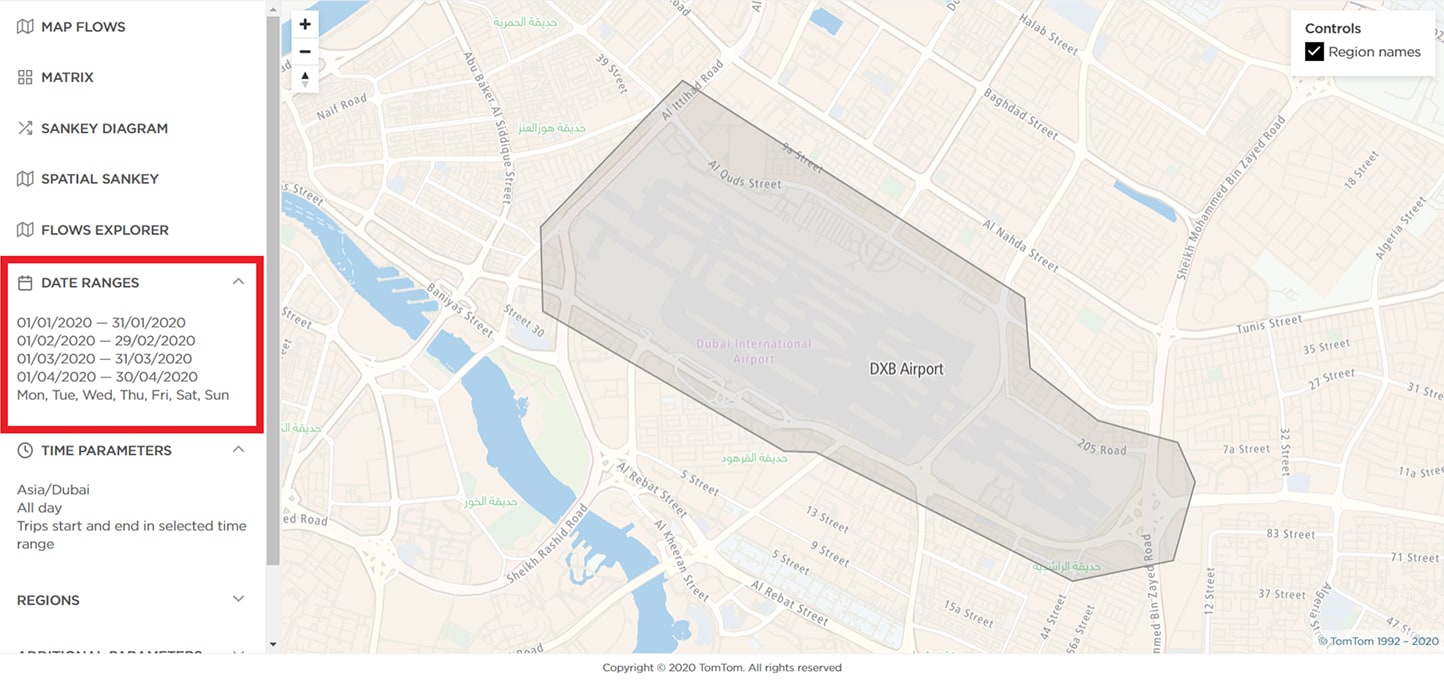 Figure 1: Zone and date range definition
Reading the results
In OD reports with one polygon only, the most insightful visualization is “Flows Explorer”, where “External” trips can be defined as “origins” (i.e.: all trips that started outside the “DXB Airport” region). Setting “DXB Airport” as our destination, will give us a clear view on the trip distribution through-out the day (Figure 2).
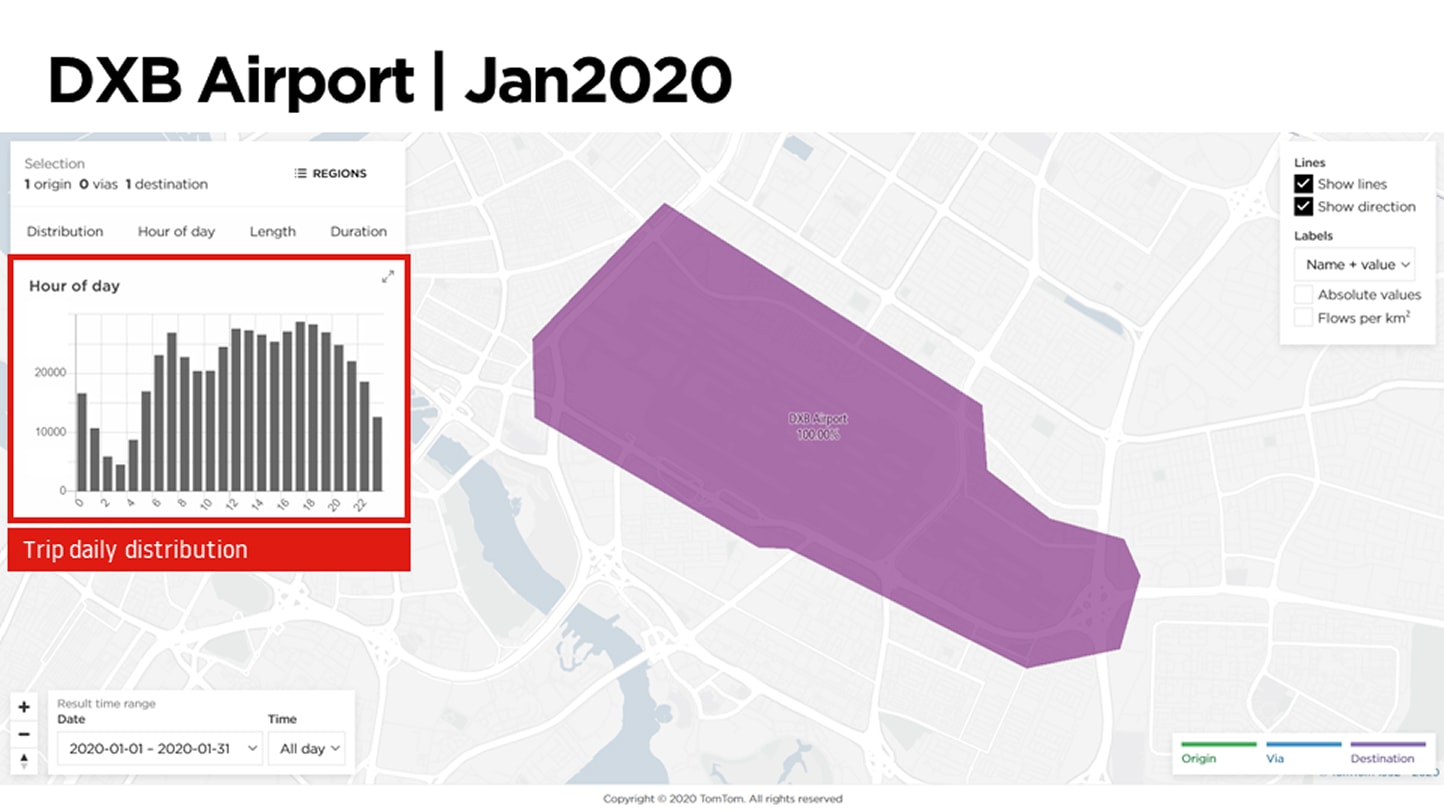 Figure 2: Trip volume in January 2020.
Progress can be assessed by comparing the following months (Figures 3 to 5).
 Figure 3: Trip volume in February 2020.
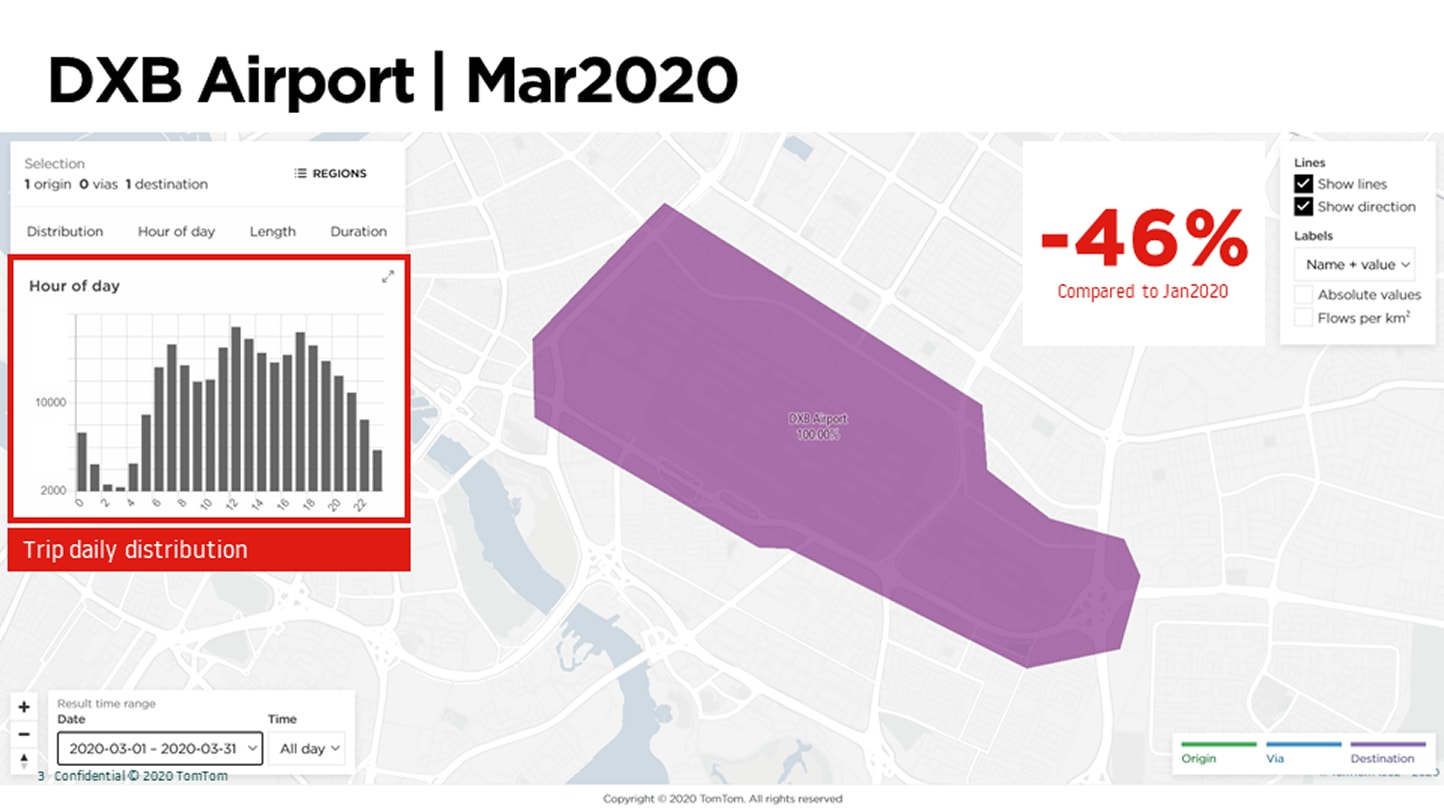 Figure 4: Trip volume in March 2020.
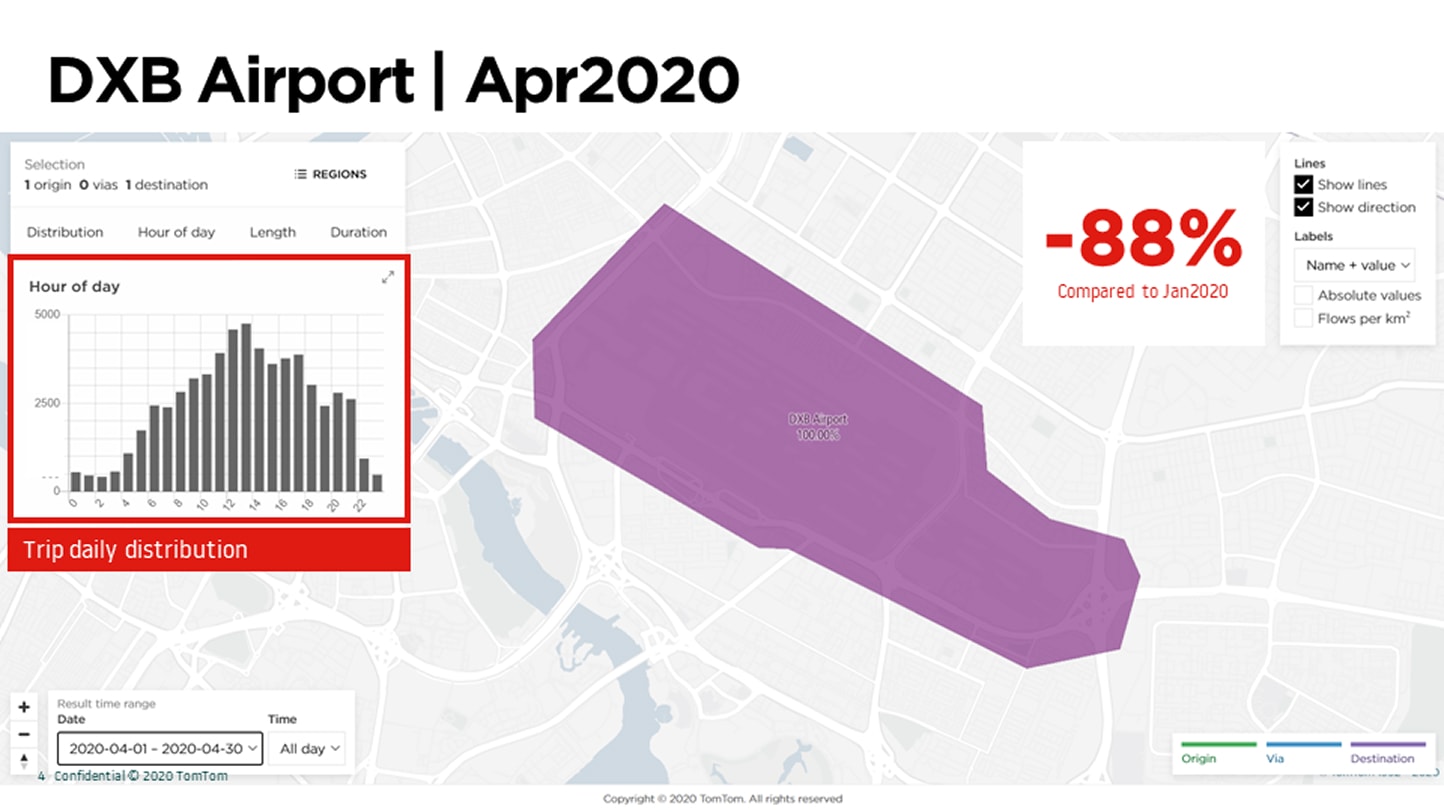 Figure 5: Trip volume in April 2020.
Conclusion
Since the beginning of the quarantine actions taken in Dubai, UAE, the volume of trips going to the Dubai International airport decreased significantly. By using the TomTom O/D Analysis data we could actually see how this decrease progressed month after month, resulting in less 88% of trips when comparing April to January of this year. To make it even a more complete analysis, we could keep performing the same analysis also for the month May and June, to understand if the volume of trips are catching up to the pre-coronavirus standards.
The TomTom O/D Analysis provides a rich, comprehensive and yet very attractive in terms of cost/value benefit. In matter of minutes, the GPS-based trip analytics give you a comprehensive analysis, encompassing large areas and flexible time periods, which would be less efficient and with poor results when performed with manual input questionnaires or only hardware data (e.g.: sensor cameras with limited area range).
People also read
)
Stadium traffic during a football match
)
Understand travel modes with O/D Analysis
)
Inside TomTom's traffic products: Origin Destination Analysis
)
'It's not going to happen overnight' — TomTom expert explains how we can fix congestion
* Required field. By submitting your contact details to TomTom, you agree that we can contact you about marketing offers, newsletters, or to invite you to webinars and events. We could further personalize the content that you receive via cookies. You can unsubscribe at any time by the link included in our emails. Review our privacy policy. You can also browse our newsletter archive here.