Traffic overview
France
Cities
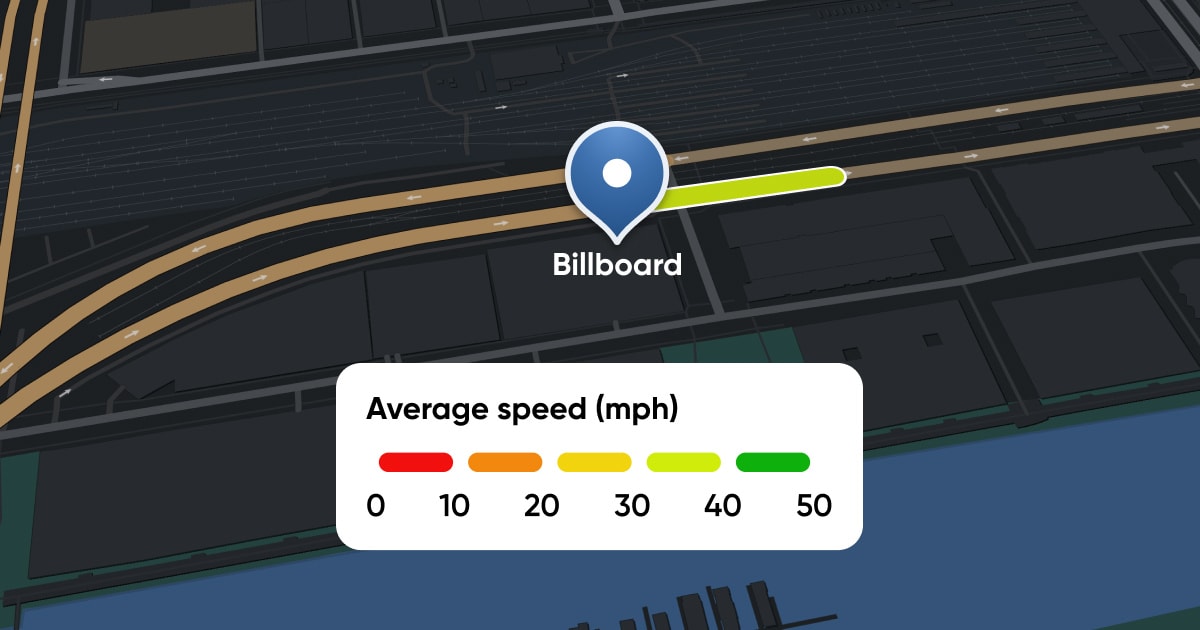
Distance driven in 15 min
How does rush hour impact traffic flow? See just how far drivers can go across different cities.
Optimal hour
Rush hour
Show more cities
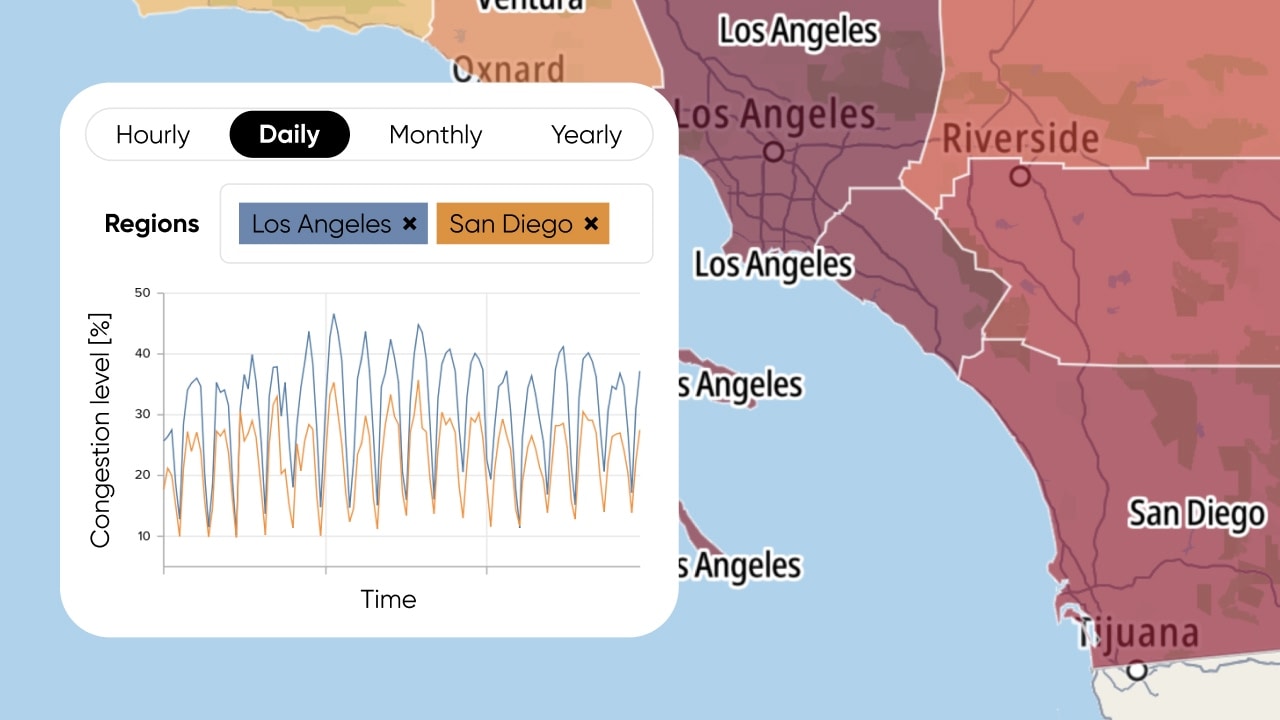
Traffic insights: side by side
Compare countries and cities to uncover patterns, similarities and differences across key mobility and traffic indicators.
2025
Find more insights on the city pages
Shape your strategy with world-leading data
TomTom's suite of tools and services turn traffic data into valuable, actionable insights.
Insights that know no bounds
Download ready-to-go reports or draw your own conclusions with TomTom's Area Analytics tool.
-
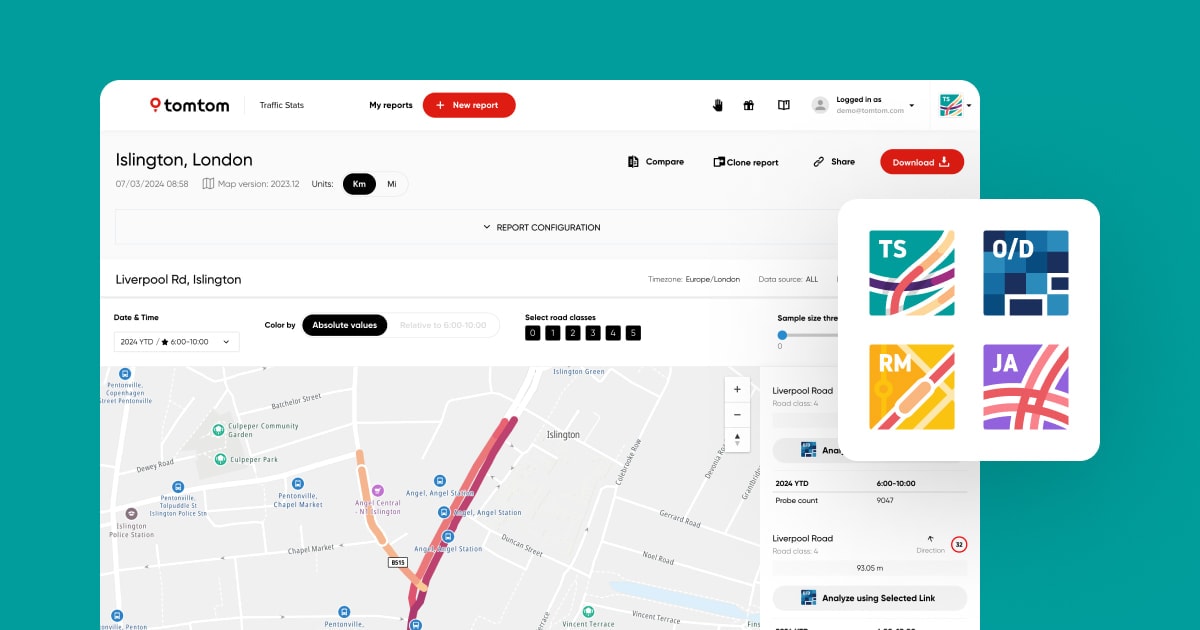
Traffic analytics
TomTom MOVE
Ready-to-use reports and data visualizations from our analytics tools.
Learn more →
-
Solution
Government and public sector
Enhance citizen safety and support sustainable urban growth.
Learn more →
-
Solution
Traffic and mobility intelligence
Helping governments and city planners improve traffic and travel.
Learn more →
-
Demo
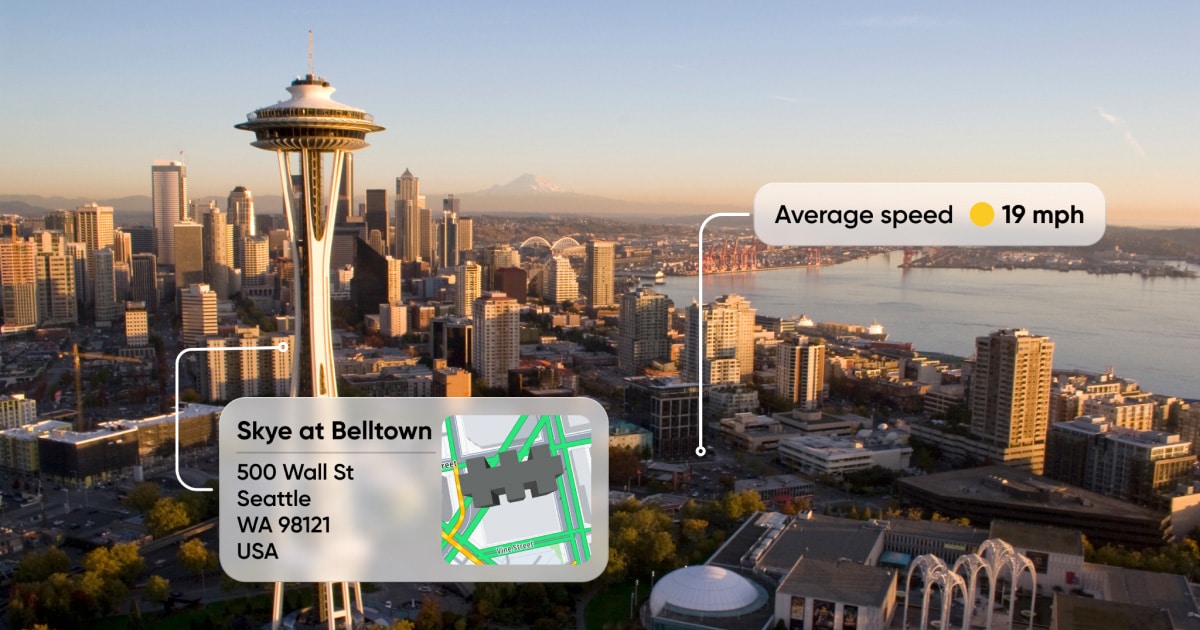
Smarter store placement
A furniture brand uses traffic data to choose the best location for its San Francisco store.
Start demo →
Let’s change the way the world moves!
Decision-shaping data for traffic engineers, policy leaders and transport planners.
-
Make your own reports in seconds
Use our web portal to access reports with ready-to-use data visualizations and download the results for your own custom analysis.
Get 30 days free →
-
Get in touch
We help your cities, cars or policies tackle traffic better. Leave your details and we’ll get in touch.
Contact us →

