)
The latest TomTom Traffic Index has arrived. Covering traffic trends for 2023, this year’s edition surveys 387 cities around the globe and covers metrics such as congestion, average travel time, the impact of rush hour and the environmental impact of congestion in our cities. It also tracks the cost of driving which, in a world struck by an increase in the cost of living, is becoming an important consideration for many motorists. Here are the headlines from this year’s report.
Summary:
London has some of the world’s worst traffic.
U.S. cities have some of the lowest travel times in the world.
Cities are all affected by traffic in different ways.
To reduce traffic, we need to think beyond the car, a TomTom traffic expert says.
View the full Traffic Index yourself.
What cities have the worst congestion?
London is the world's slowest city
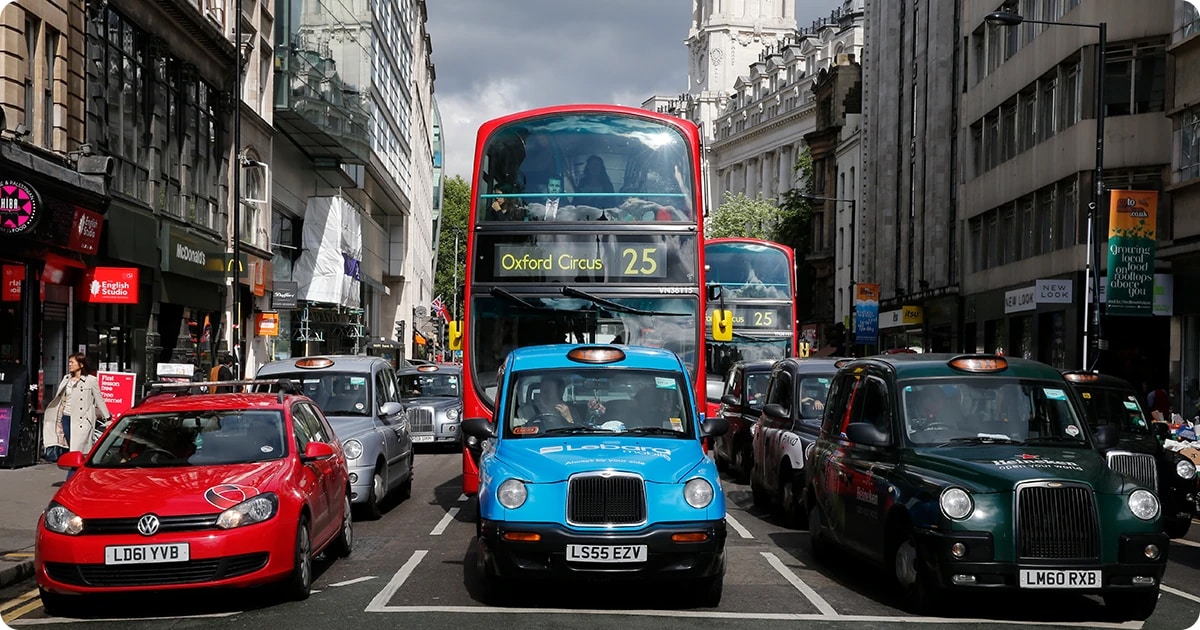
Unfortunate news for residents of The Big Smoke — London is still the world’s slowest city, according to the TomTom Traffic Index.
The average travel time for a typical 10 km* journey in the city in 2023 was 37 minutes and 20 seconds. This is one minute more than in 2022 and nearly two minutes more than in 2021 — indicating a slow but steady return to the pre-pandemic trend of consistently increasing traffic.
The situation for the average driver who commutes 10 km in the morning and 10 km in the evening, at peak times, is worse still. These drivers spend one hour and 28 minutes in traffic every day, losing about 38 minutes each day to the extra traffic that comes with rush hour busyness.
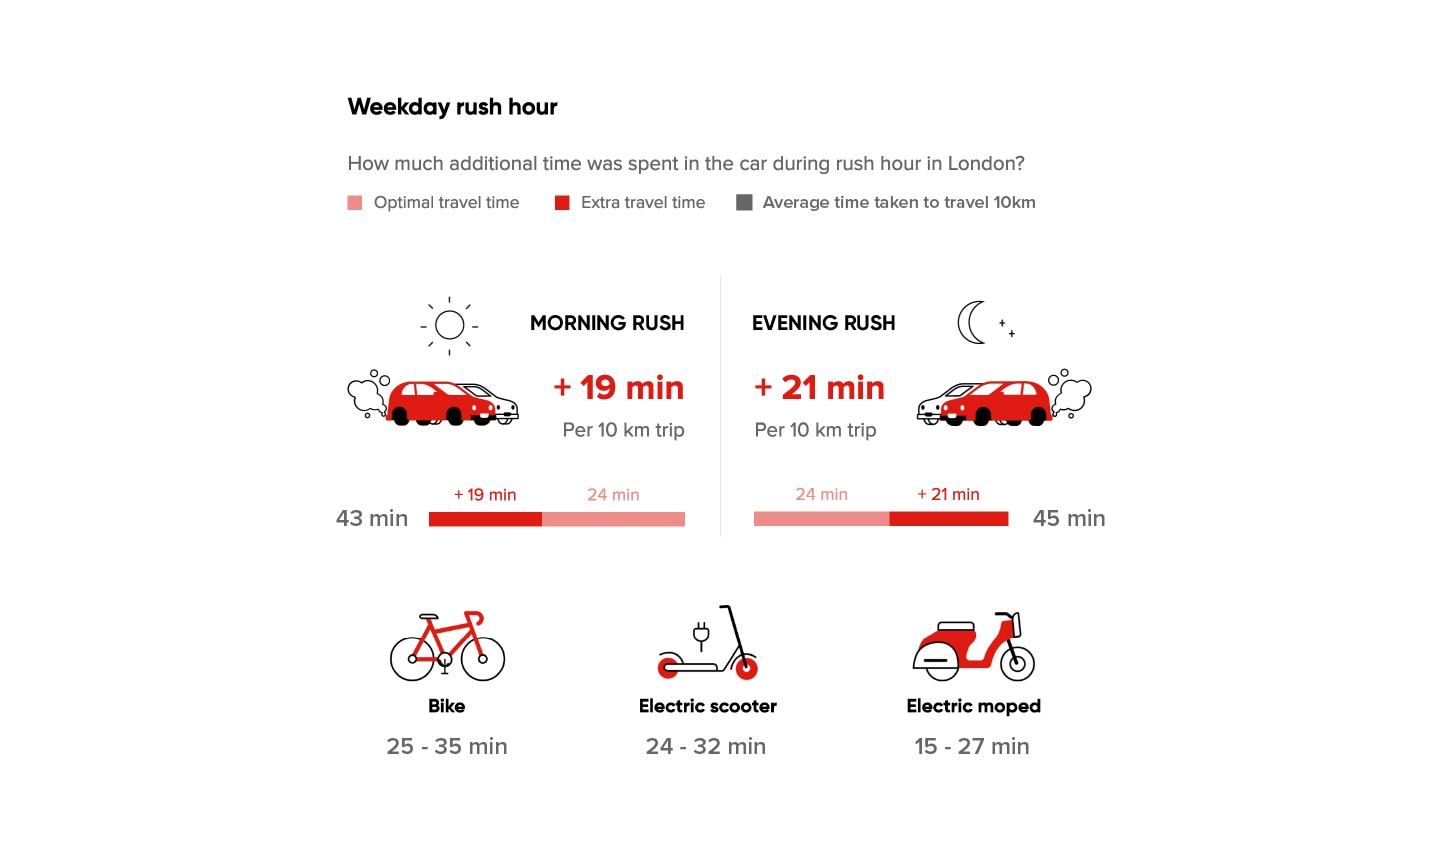 How much time are drivers losing to rush hour traffic in London? Bicycles and mopeds seem like a good option if time is a concern.
Dublin, Toronto, Milan and Lima suffer with congestion
As London takes the top spot, Dublin, Ireland; Toronto, Canada; Milan, Italy and Lima, Peru take second, third, fourth and fifth spots, respectively, when ranked by the average time it takes to drive 10 km across each city.
In Dublin drivers spend 29 minutes and 30 seconds on average driving 10 km. In Toronto, they spend 29 minutes for the same drive. In Milan, drivers spend 28 minutes and 50 seconds, while in Lima, it took drivers 28 minutes and 30 seconds to cover 10 km.
In these four cities, drivers lose an average of one minute for every kilometer they drive because of overall traffic and congestion.Though we shouldn’t single out these five cities. Traffic is a challenge all over the globe. There are 80 other cities from all over the world in this year’s index where it takes drivers more than 20 minutes to complete a 10 km trip.Some cities experience traffic worse than others
Using the average 10 km travel time to compare cities is a good starting point to understand traffic on a global scale. However, to understand the impact traffic has in each individual city we must look closer.
Take London for example, while it’s the slowest city in the world with traffic, it’s also the slowest city in the world when traffic is moving optimally (in free flow condition, when travel times are at their lowest, such as in the middle of the night).
In optimal conditions, it still takes drivers in London about 25 minutes to complete the 10 km trip. In other words, traffic costs London drivers over 12 minutes every 10 km, on average.
Not all cities are affected by traffic as much, though — Japanese cities fare much better. For instance, in Tokyo, a 10 km drive in optimal traffic will take about 18 and a half minutes. With traffic, that same journey would take 23 minutes and 40 seconds. Here, drivers lose only six minutes to traffic congestion — half what Londoners lose.
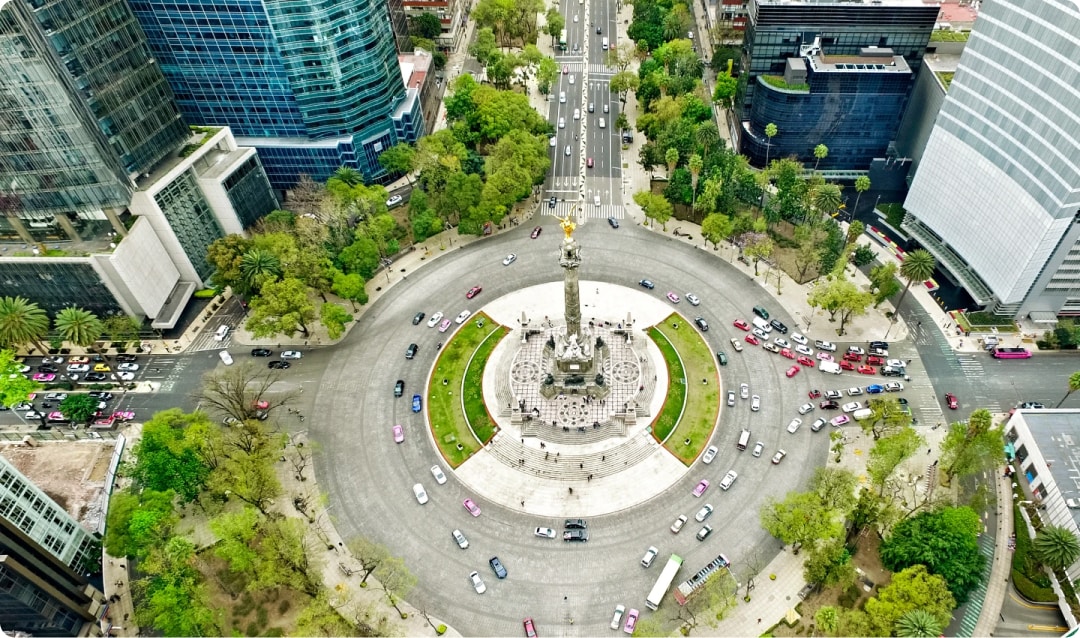
Mexico City, Mexico, is also an interesting case. In optimal traffic it takes just 14 minutes and 25 seconds to drive 10 km across the city. However, with traffic, that journey time goes up to 26 minutes and 30 seconds on average, meaning that drivers lose over 12 minutes to traffic.
In terms of time lost to traffic, Mexico City is the world’s second worst after London, but in terms of raw travel average travel time it ranks as the world’s 15th slowest city — which suggests the relationship between traffic and its impact on travel times and average speeds is not universal.
Which cities get traffic right?
This might come as a surprise, but American cities buck the trend and, according to the TomTom Traffic Index, manage traffic well. In cities like Dayton and Akron, Ohio, and Albany and Syracuse, New York, drivers lose very little time to traffic.
Organizing the Traffic Index data by lowest travel times, you’ll see many other American cities, including Detroit, Memphis, St. Louis, Tulsa, Cincinnati and Buffalo.
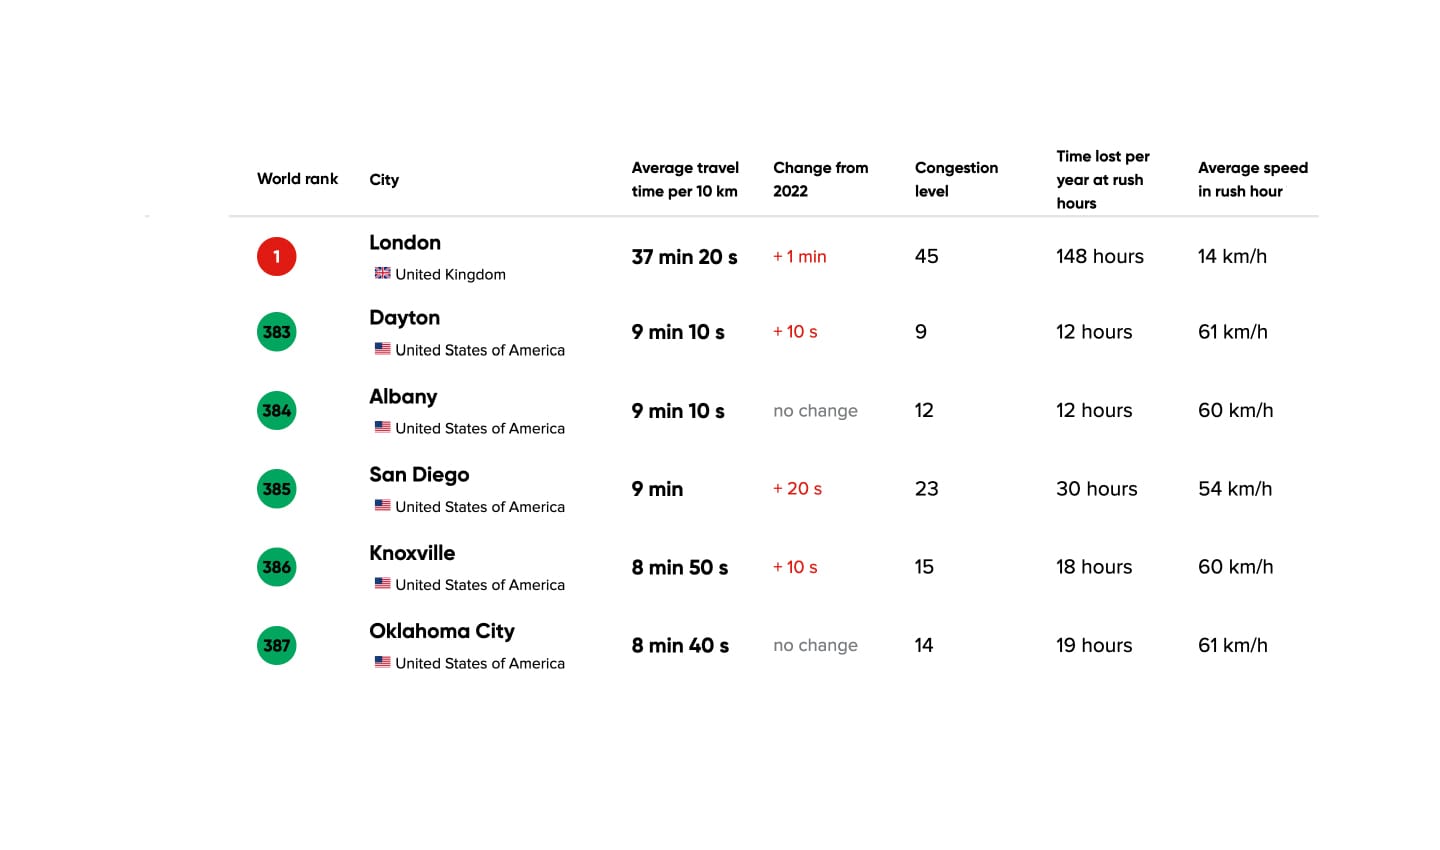 Thanks to highways that run through their middle, American cities fair well in the Traffic Index with average speeds remaining high.
On average, it takes just 10 minutes to travel 10 km across these cities with traffic, and about eight minutes and 30 seconds in optimal conditions. What’s important to note is that all these cities have large highways running straight through them, the average speeds in all these American cities are over 60 kmph. This kind of infrastructure is a uniquely modern invention and simply wouldn’t fit in places like London or Dublin. Also, while it might lead to lower travel times, whether it creates an equitable and livable city is another question entirely.
What's the solution for congestion? Traffic of the future
Ralf-Peter Schäfer, TomTom’s VP Product Management of Traffic, Travel and Routing, says we need to think about traffic beyond cars to solve congestion. “Traffic shouldn’t just be about managing cars or making the situation better for cars, we need more than that,” he said in a recent Q&A.
“Ralf-Peter Schäfer
TomTom VP Product Management of Traffic, Travel and Routing
Schäfer compares London and Amsterdam - both are limited when it comes to space, but one manages its traffic better. To complete a 10 km journey in the Dutch capital takes 17 minutes and 10 seconds on average, with drivers losing just four minutes and 21 seconds because of traffic — and this is a city famed for cycling, not driving.
Amsterdam is famous for bikes not just because it’s flat and cyclable, but it’s thanks to the excellent cycling infrastructure, which includes segregated cycle lanes, bike parking and a legislative hierarchy that protects the most vulnerable road users. Amsterdam also has a robust public transit network and many pedestrian walkways and pedestrianized zones. All this lightens the load on the roads and helps keep people moving regardless of their chosen mode of transport.
London, by comparison, is dominated by the car. And in all cities surveyed its drivers lose the most time to traffic and congestion. By TomTom’s Traffic Index, it’s clear that cities like London need to examine their modal split to reduce vehicular congestion in the city.
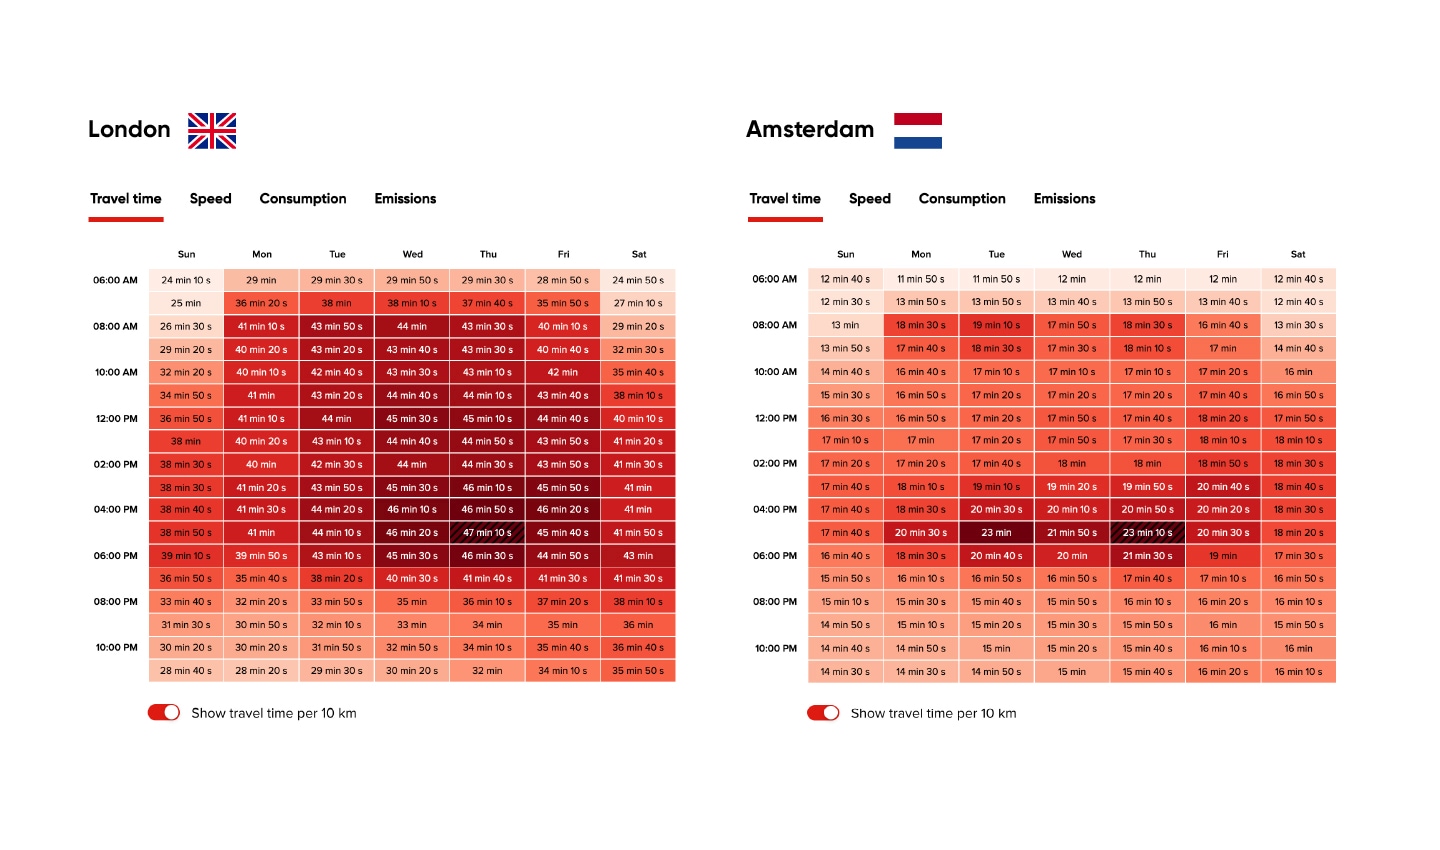 London Vs. Amsterdam, despite both being old cities, with plentiful traffic, one seems to do better than the other.
The challenge of comparing cities
The time it takes to travel across a city is a complex combination of how many cars are on the road, infrastructure, speed limits, public transit use, congestion charges, how traffic is managed and if there are low emission zones. All these things affect how, when and where vehicles travel.
With TomTom’s Traffic Index, we can examine those cities where drivers lose less time to traffic and compare them to those where drivers lose a lot. We can begin to answer questions such as: how can we improve traffic flows? How can we help people make more mindful journeys? How can we reduce emissions? How can we improve last mile deliveries? How can we make cities better for everyone?
Look at the data for yourself and see what you can find.
If you want to dive deeper into global traffic trends for 2023, check out the full TomTom Traffic Index.
If you want to read the full methodology, click here.
*TomTom’s Traffic Index computes the average travel time for a 10 km journey with average and peak (rush hour) traffic, compared to optimal traffic when it’s free flowing. This analysis allows TomTom to compare travel times for realistic journeys across cities around the world with consistency. All numbers cited in this article are for a typical 10 km journey. The TomTom Traffic Index also shows data in miles and computes travel time per an average six-mile trip. Six miles and 10 km are not the same, so switching between miles and kilometers yields slightly different data.People also read
)
Q&A: What's happening with global traffic, with TomTom's traffic expert
)
Measuring road traffic density: what you need to know
)
Traffic data: The key to effective road traffic management
* Required field. By submitting your contact details to TomTom, you agree that we can contact you about marketing offers, newsletters, or to invite you to webinars and events. We could further personalize the content that you receive via cookies. You can unsubscribe at any time by the link included in our emails. Review our privacy policy. You can also browse our newsletter archive here.