)
The TomTom Traffic Index numbers are in. In this edition, London takes the top spot as one of the world’s busiest and most expensive cities for drivers. But it's also the slowest city on the planet.
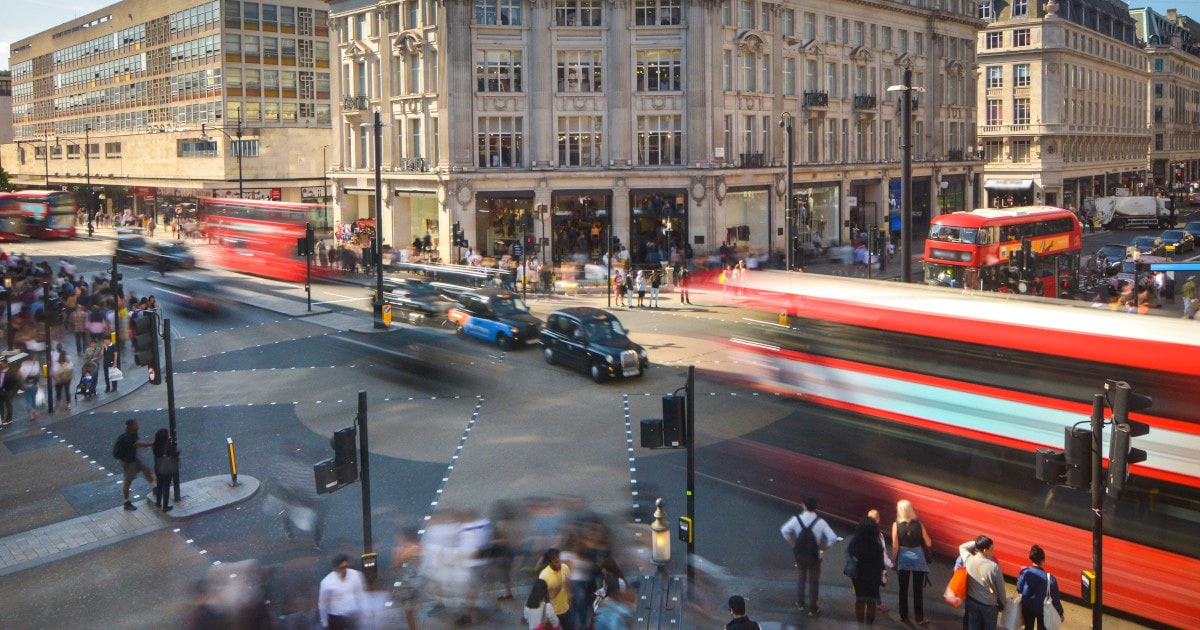
If you’ve ever been to London, UK, you’ll know how bad its traffic is. It’s dense and unrelenting. While it’s at its worst during rush hour, it’s not much better at other hours of the day.
In 2022, London’s rush hour was the slowest moving in the world, according to the TomTom Traffic Index. The average speed of motor vehicles in the city center during peak hours was just 14 kph (around 9 mph). When traffic is moving this slowly, travel times are over 40 minutes for a typical 10 km (6 mi mile) trip across the city center.
On Thursday evenings between five and six o'clock in the afternoon, traffic is at its worst in London. The average speed during these hours is around 13 kph.
When traffic is moving optimally in London’s city center, average speeds hover around 25 kph. Across the entire year, the overall average speed is 17 kph.
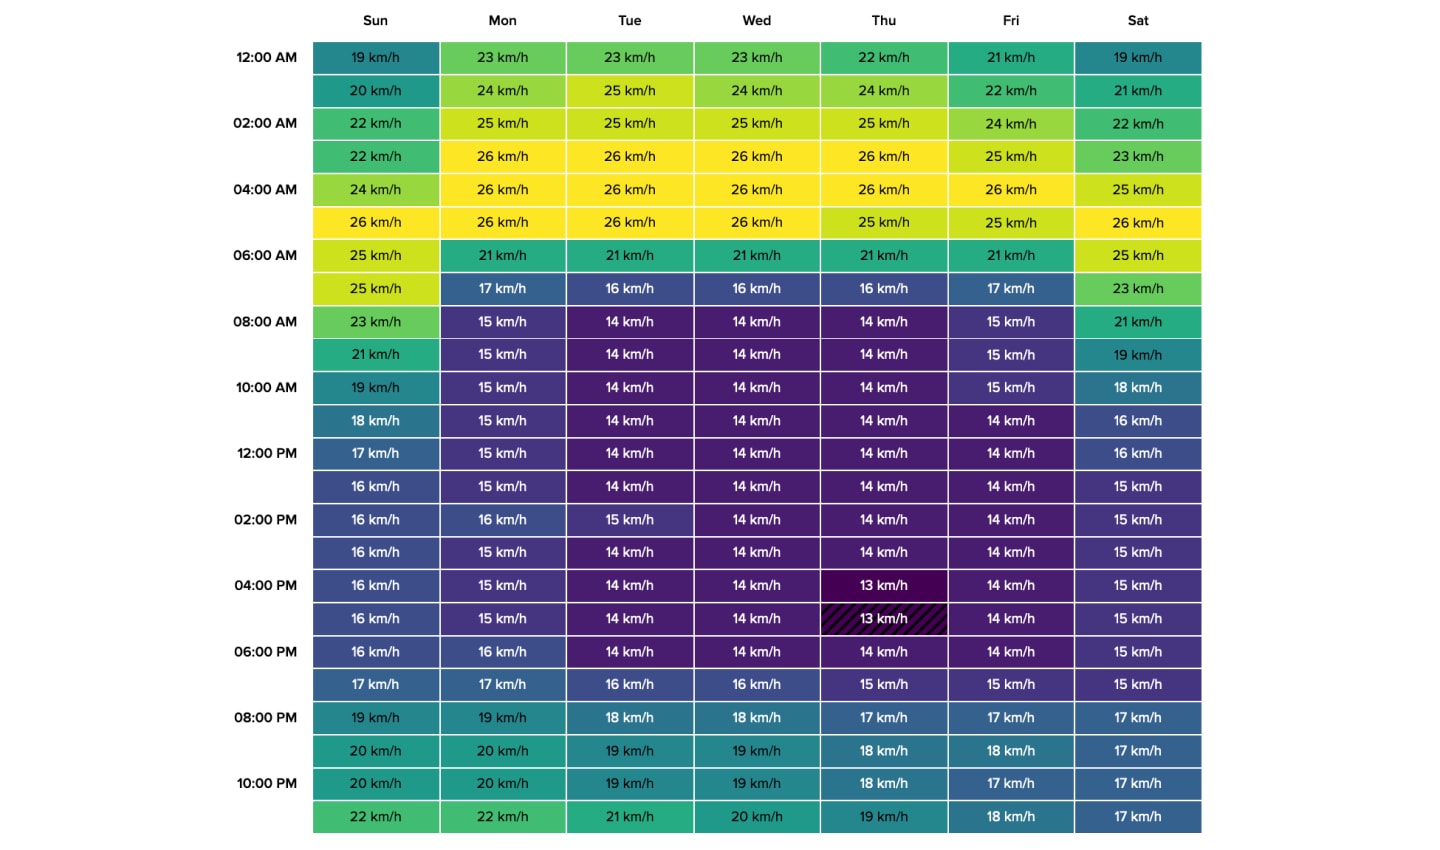 Average speeds across London's city center can be as low as 13 kph and as high as 26 kph depdning on what time of day you drive. Should delivery firms avoid the middle of the day all together?
Travel times in the city
It takes 36 minutes and 20 seconds to complete a typical 10 km journey across London. At peak times, average travel times hover around 40 to 45 minutes for a 10 km trip. This equates to around 139 hours lost to traffic at peak hours for commuters.
Compared to last year, drivers lose nearly two minutes more over a 10 km journey.
Outside the city center, traffic isn’t quite as bad. In the greater metro area, London ranks 66th in the index, on travel times.
Driving speeds during rush hour, outside the center, average around 34 kph (around 21 mph). With the average 10 km trip taking just 15 minutes. Drivers in this area still lose time to rush hour delays, though, 43 hours to be exact.
It's not just about travel times
When it comes to driving costs, the story’s not much better. As TomTom’s Traffic Index highlights, in 2022, commuters driving petrol cars spent 28% more on fuel than in 2021. For diesel drivers, the cost increased by 33%.
In raw numbers, typical commuters who drive petrol vehicles in London’s city center at peak hours spent $948 (£773), diesel drivers had to shell out $876 (£715) over the course of the year.
Avoiding peak hours could save drivers, $279 in petrol and $208 in diesel, per year.
How bad is traffic in other cities?
Every other city included in TomTom’s Traffic Index posted an average rush hour speed of at least 17 kph (around 10.5 mph). Average yearly 10 km travel times in every other city analyzed were less than 30 minutes.
As we know from previous editions of the Traffic Index, compared to metropolitan areas, traffic is worse in urban areas, where vehicle movement is denser, roads are smaller, speed limits are lower and emissions regulations may be enforced.
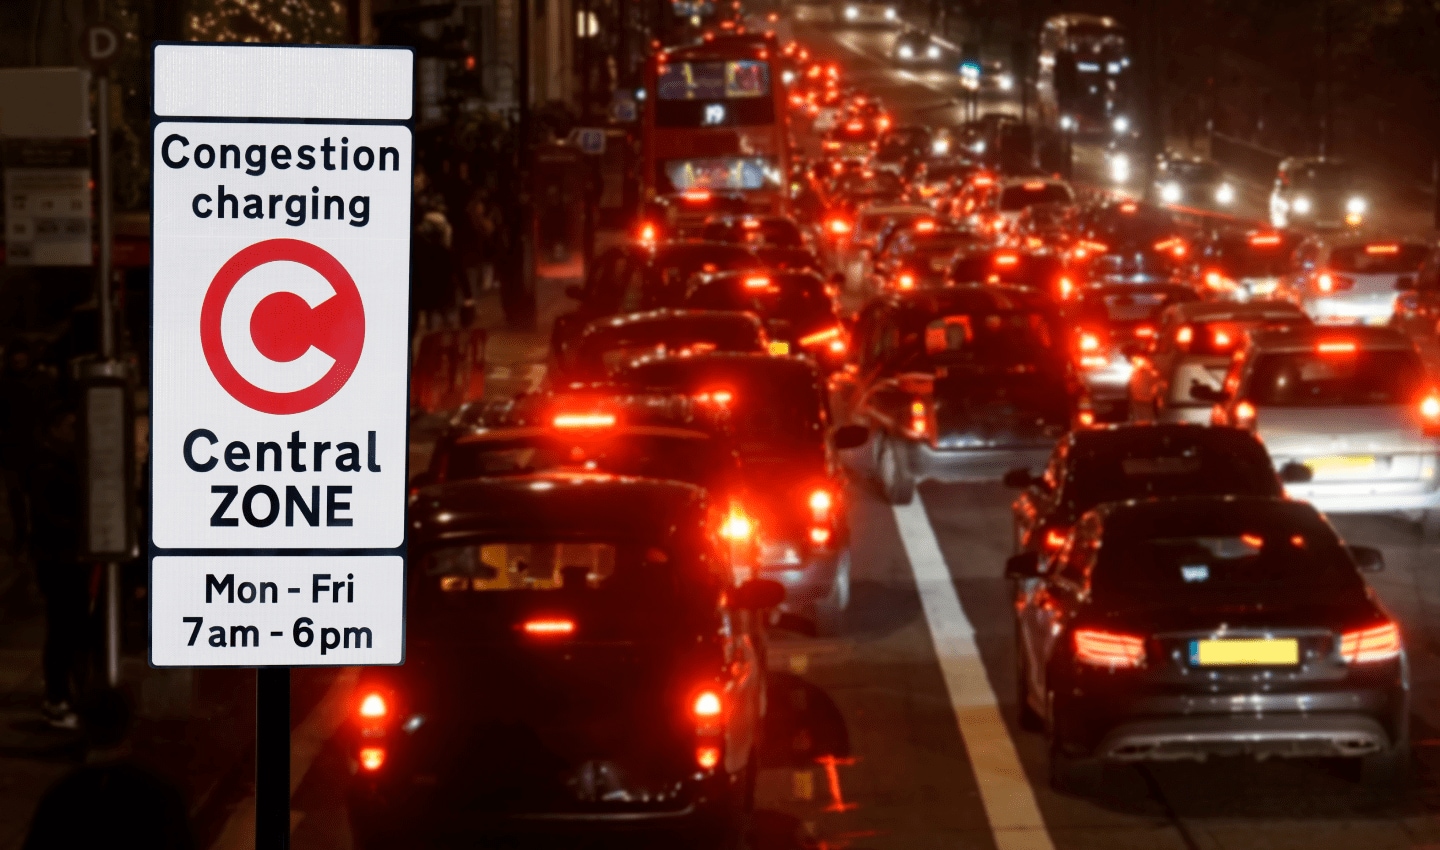 Traffic in London is worst at rush hour, obviously. Even despite initiatives such as congestion zone charges, people still rely on their vehicles. Scenes like the image above are all too familiar for Londoners.
Unsurprisingly, the slowest-moving city centers in the world are those with dense, complex road networks. Like London, cities such as Paris, Dublin, Rome, Manila and Bucharest, are all slow to get around, with 10 km trips taking more than 25 minutes.
Road networks, speed and traffic
Cities with faster-flowing road networks and highways demonstrate the best average travel times over 10 km journeys. They also tend to be cheaper to drive in too.
Young American cities bode very well. In fact, cities including Detroit, Cleveland, San Diego, Riverside, Oklahoma City, Knoxville, Charleston, Greenville, Dayton, Albany, Fresno, Syracuse, Jacksonville, Raleigh, Salt Lake City, Tulsa, Cincinnati and seven others all allow drivers to take 10 km trips in 10 minutes or less.
Raleigh, North Carolina, is the cheapest city in the U.S. for petrol drivers. Over the year, an average commuter who travels 10 km to and from work, will pay around $307 per year. This is up $52 from last year.
Tucson, Arizona, is the cheapest city in the U.S. for diesel drivers. They pay $318 per year for fuel used to commute. Owners of diesel vehicles have had to stomach a large cost increase though. In Tucson, the same level of commuting a year earlier would have cost them just $222, meaning they paid $96 in 2022.
Let's not be so hard on London
While London’s traffic and cost scores aren’t great, it’s not the kind of city you can drive across quickly to begin with. Of all the cities analyzed, London has the slowest 10 km trip time even in optimal conditions, TomTom estimates it would take 24 minutes 22 seconds to complete a 10 km trip. Add lots of traffic and rising fuel costs to that and the situation becomes dire quickly.
Given that the average time with traffic is 36 minutes 20 seconds, drivers are losing around 12 minutes. Cities like Bengaluru, India and Mexico City, Mexico fare similarly.
In Bengaluru, an optimal 10 km trip can be completed in 16 minutes 27 seconds. But add traffic to that, and it goes out to 29 minutes 10 seconds. In Mexico City, average travel times are around 24 minutes 40 seconds, with optimal times being 14 minutes 38 seconds.
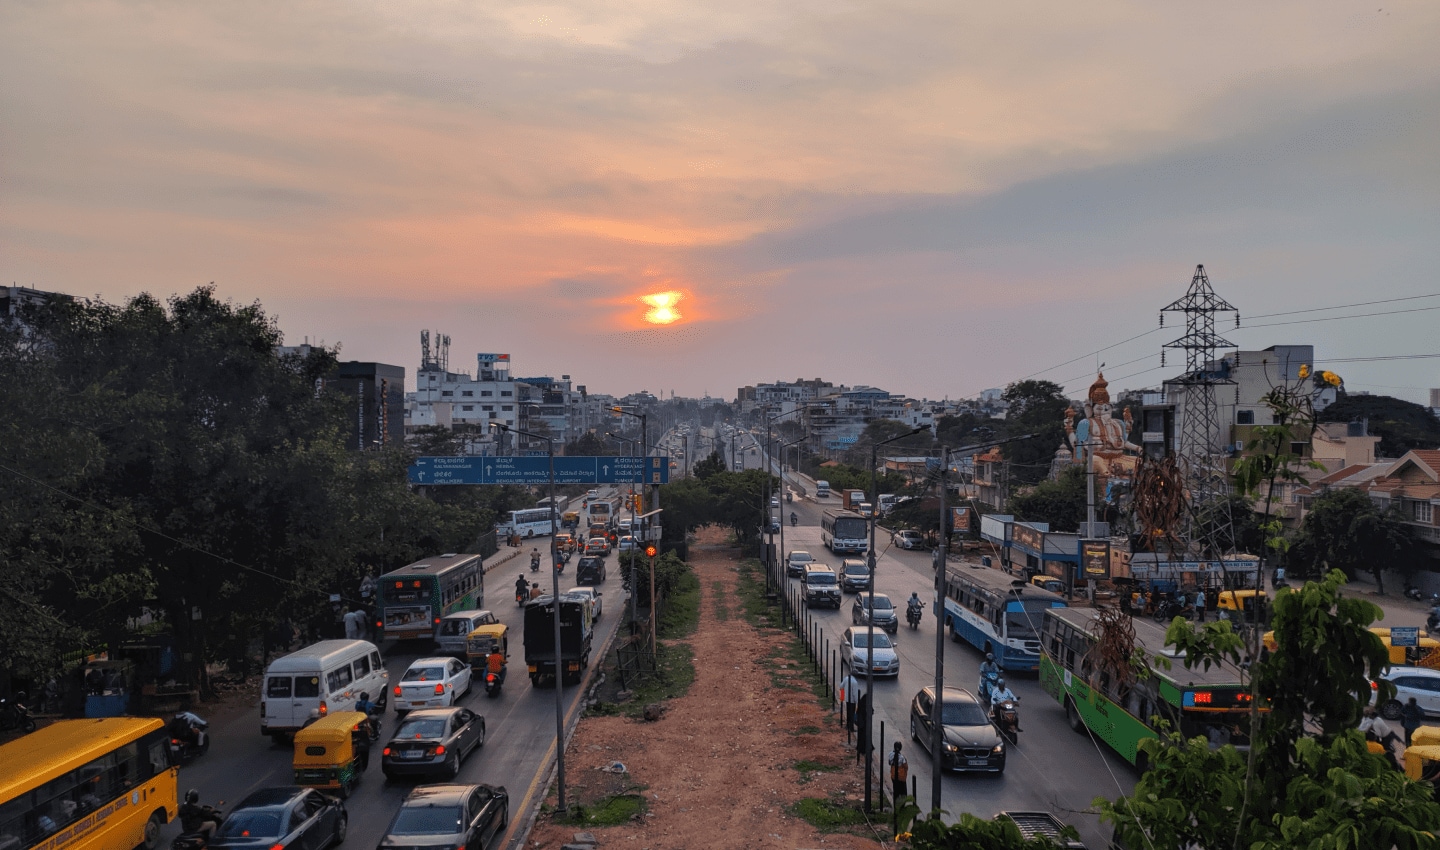 Traffic in Bengaluru, India, is diverse. There are two-wheelers, buses, cars, vans, tuk-tuks and bicycles. It's certainly more diverse than London.
So, let’s not be too hard on London, it might be the slowest and one of the most expensive cities in the world for drivers, but it’s not alone. Traffic is a universal challenge that every city in the world faces. Whether it’s high costs, congestion and traffic density, or slow travel times, it’s something we all must navigate. And it's something we all must fix.
If you want to dive into the numbers for yourself, check out TomTom's full Traffic Index. Follow the link below.
A few words on the methodology
TomTom has modified its approach to calculating congestion for this edition of its Traffic Index report. In previous editions, the company calculated congestion by measuring the additional time required to complete a trip compared to how long that same trip would take if traffic was free flowing.This year, TomTom is simulating how long it takes to complete a trip of 10 km. By splitting up all journeys taken into smaller chunks and then reconstructing them into different 10 km routes and calculating their travel times, TomTom says it gains an insight into traffic that more closely represent driving conditions in the real world. It also allows driving conditions in different cities to be compared more consistently, as the new method means that the length of a particular journey doesn’t distort the findings.If you want to read the full methodology for yourself, click here.
People also read
)
The world needs a better map: TomTom is making it with its new Orbis Maps and ecosystem
)
Super sources will power the 'freshest map on the planet.' But what are they?
)
What does TomTom Traffic Index data tell us about the world's busiest cities?
)
TomTom's CTO, Eric Bowman, on the company's new strategy and Orbis Maps
* Required field. By submitting your contact details to TomTom, you agree that we can contact you about marketing offers, newsletters, or to invite you to webinars and events. We could further personalize the content that you receive via cookies. You can unsubscribe at any time by the link included in our emails. Review our privacy policy. You can also browse our newsletter archive here.