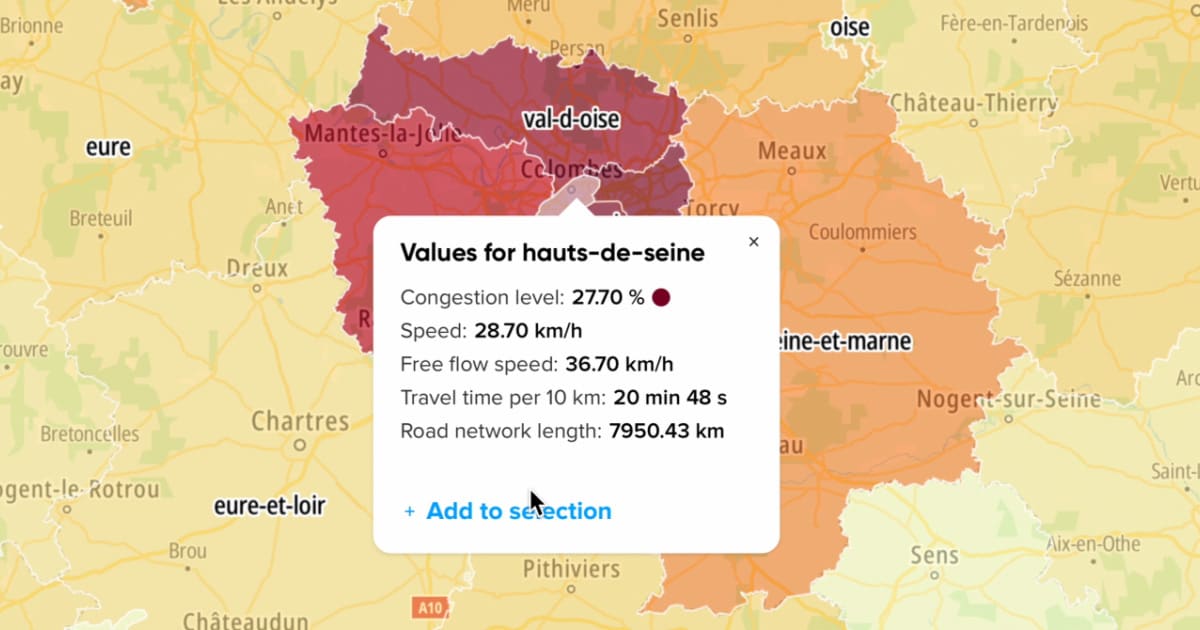
Unlock granular traffic CSV data for every hour of the day, available for free to inspire your exploration and insight discovery. Each dataset provides key indicators—speed, free-flow speed, congestion level, and travel time per 10 km—to support research, planning, and mobility insights. For even more comprehensive data gathered from 2018 until today, explore our Area Analytics product to gain deeper insights into traffic patterns. Dive in and uncover patterns to enhance your understanding of traffic dynamics!
Downloads
New York City, US
ZIP - 207.39 KB
Chicago, US
ZIP - 41.93 KB
Los Angeles, US
ZIP - 43.46 KB
Mexico City, Mexico
ZIP - 41.82 KB
Paris, France
ZIP - 40.49 KB
Dublin, Ireland
ZIP - 42.79 KB
Berlin, Germany
ZIP - 40.37 KB
London, UK
ZIP - 540.81 KB
Tokyo, Japan
ZIP - 634.94 KB
Bangkok, Thailand
ZIP - 41.31 KB
Sydney, Australia
ZIP - 569.07 KB
Shape your strategy with world-leading data
Don’t see your city? No problem we have the data in Area Analytics!
Download ready-to-go reports or draw your own conclusions with TomTom's Area Analytics tool.
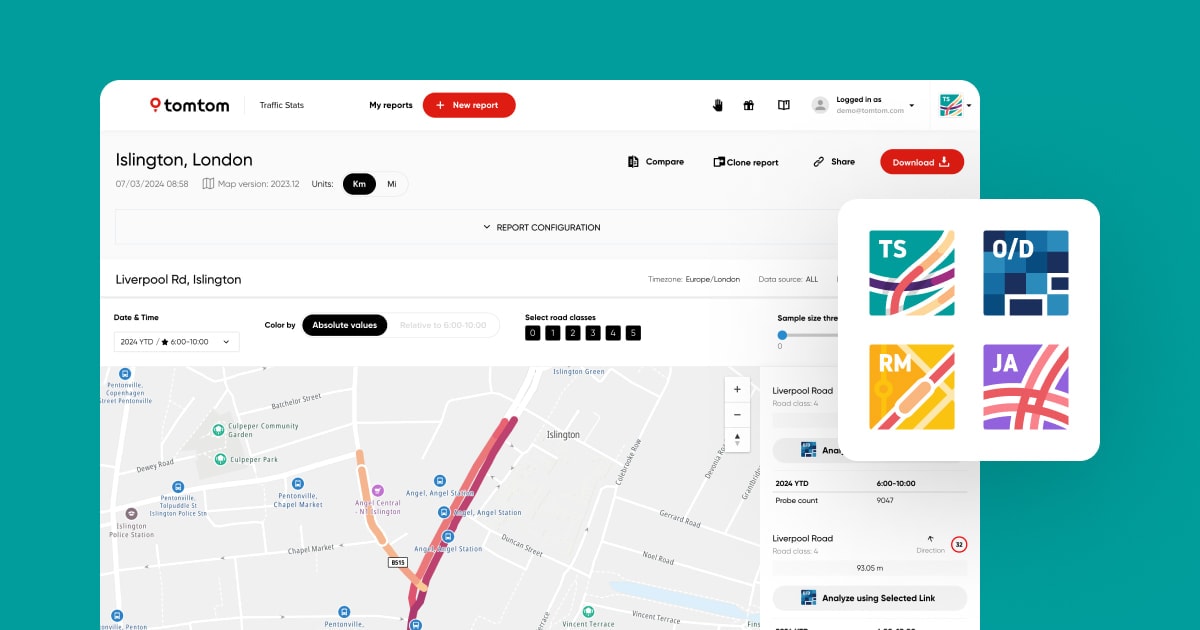
Traffic Analytics
TomTom MOVE
Ready-to-use reports and data visualizations from our analytics tools.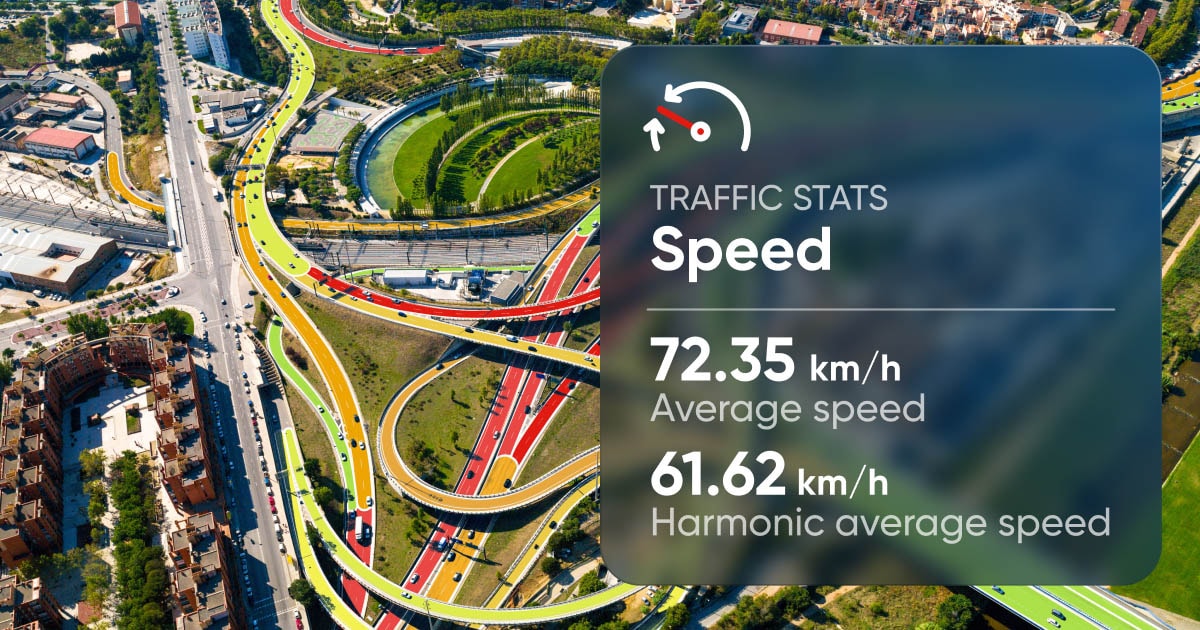
Product
Traffic Stats
Understand, predict and reduce congestion.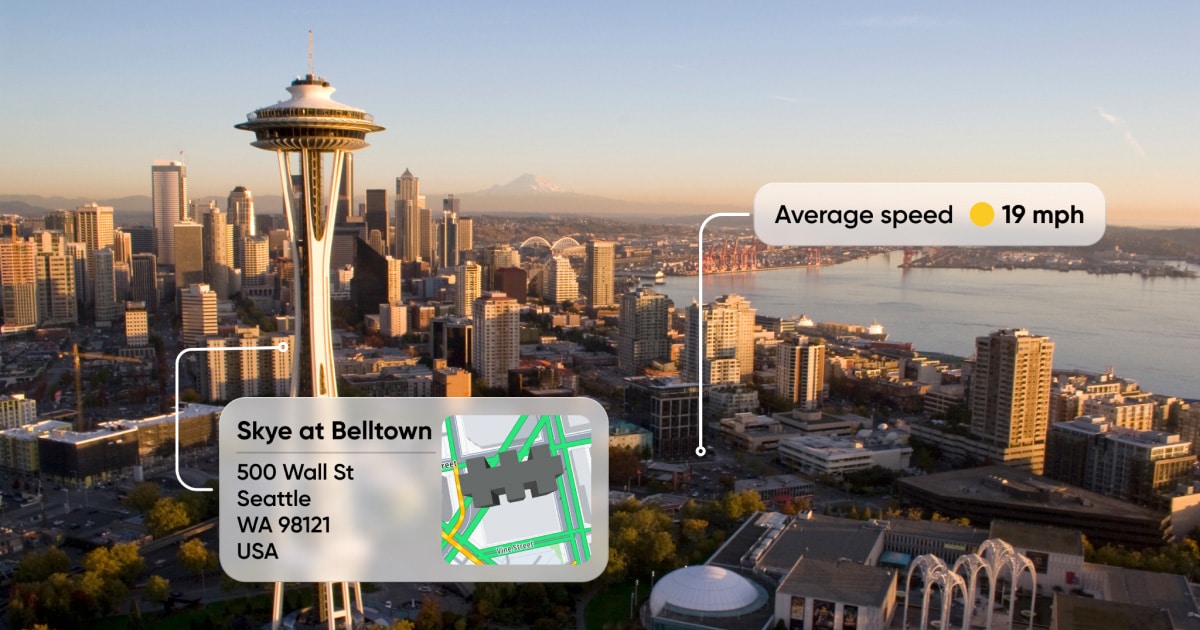
Solution
Government and public sector
Enhance citizen safety and support sustainable urban growth.
Demo
Managing bridge and tunnel closures
Mobility data helps keep traffic moving during roadworks.