)
Tactile mapping is not something most of us will have heard of, but it’s incredibly valuable. It’s used to give blind and visually impaired people an understanding of geography, as well as provide a multisensory format for anyone to learn about the world around them. It’s not talked about enough.
When you think of maps, you’ll immediately picture something with drawn-out boundaries, roads and continental shapes. There’ll be details showing forests, different colors indicating road types and symbols to show where points of interest are. Maps are visual by their nature – to read them you must be able to see these various markings on the page or screen. Or, at least, that’s what you might think if you can see without much difficulty.
Not everyone has fully functioning sight. That forces visually impaired people to navigate the world in a very different way. And these differences aren’t always catered for. For centuries, maps were a tool only accessible to those who could see. In a world where an estimated 253 million people are visually-impaired, and another 40 million are blind, it’s vital that they be given the chance to discover and move through the world with as much ease as possible.
That’s where tactile mapping comes in.
Blind and visually impaired people with a good grasp of orientation often have an evolved sense of spatial cognition and mobility skills. In the past, some studies have suggested that tactile maps are useless to blind people, though this was debunked, and tactile maps have become more commonly accepted.
We spoke to tactile mapping expert, Waldirene Ribeiro do Carmo, to learn more. Indeed, the first thing she noted: while tactile maps were designed primarily for blind and partially sighted people, “they should be used by everyone, enabling multisensory and inclusive learning.”
Do Carmo became interested in tactile mapping after working in the Laboratory of Geography Education and Teaching Materials of the Department of Geography of the School of Philosophy, Literature and Human Sciences of the University of São Paulo. There, she met Professor Regina Araujo de Almeida – one of the foremost experts in tactile mapping, who has worked in the field since 1989.
Do Carmo recounts how, while working at the laboratory, people would come to them to learn about tactile maps to help students with visual impairments. As her interest in tactile mapping grew, she participated in a project alongside researchers from Chile, Argentina and Brazil, aimed at producing tactile materials about Latin America.
“This project motivated me to specialize in the subject,” Do Carmo says, “and study it in my master’s and doctoral studies.”
Tactile mapping provides the opportunity for multisensory and inclusive learning.
A map for the history books
Tactile mapping began gaining academic traction in the 1800s. As do Carmo tells us, “Tactile maps have been handcrafted and individually produced since the 19th century.”
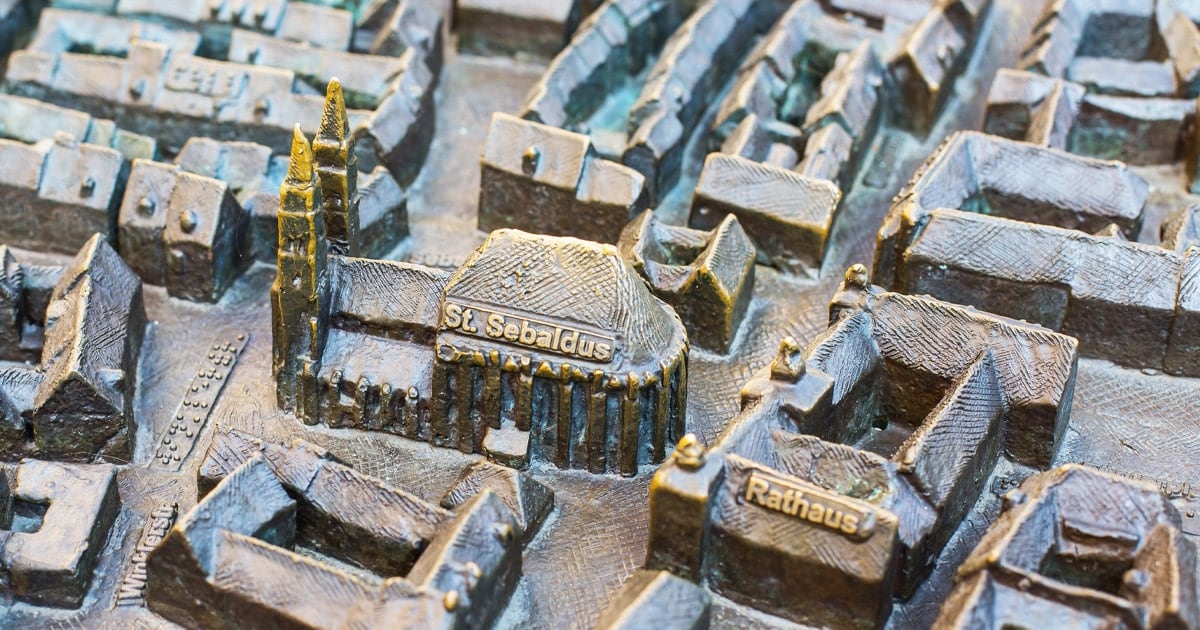
The first was patented in 1837, in an atlas of the U.S., by Samuel Gridley Howe, who worked at the Perkins School for the Blind. Tactile maps, designed to teach blind children were then popularized by K.R Klemm, a superintendent at blind schools in Ohio. Inspired by an educational strategy that Klemm learned in Europe, the map was created on waterproof paper with raised lines, so that the children could feel the various borders and lines used to create the image. Klemm would painstakingly create these maps, with the help of his students, by scraping and carving the plaster to create indentations of mountains and plateaus.
“During the 18th and 19th centuries, and even part of the 20th century, almost all tactile geographic maps were handcrafted and used to teach blind children,” do Carmo says. “Despite the development of techniques for the industrial production of maps, individual production continued, and school maps continued to be produced in a handmade way for a long time.”
Tactile maps began appearing in a variety of formats – from maps which relied on embossed topical features and raised Roman typeface, to ones that were made from a thick board and then glued onto another board, so that the roads and streets were elevated. More detailed maps such as Klemm’s would show waterways and mountains, but this was not always the case. Eventually, modern technology came into play and tactile maps could be created using machines.
An invaluable device to teach young people geographical features, and a handy tool to place in public spaces, it’s also a great way to help blind people live more independently and navigate the world on their own. And it's not just limited to teaching students with visual impairments, do Carmo says, because they can also provide a multi-sensory way for anyone to learn about cartography and geography. Like visual and auditory, tactile learning is recognized as a key educational technique.
Who, what, where?
Tactile mapping isn’t just limited to one kind of map – there are multiple different kinds, each used for a different purpose.
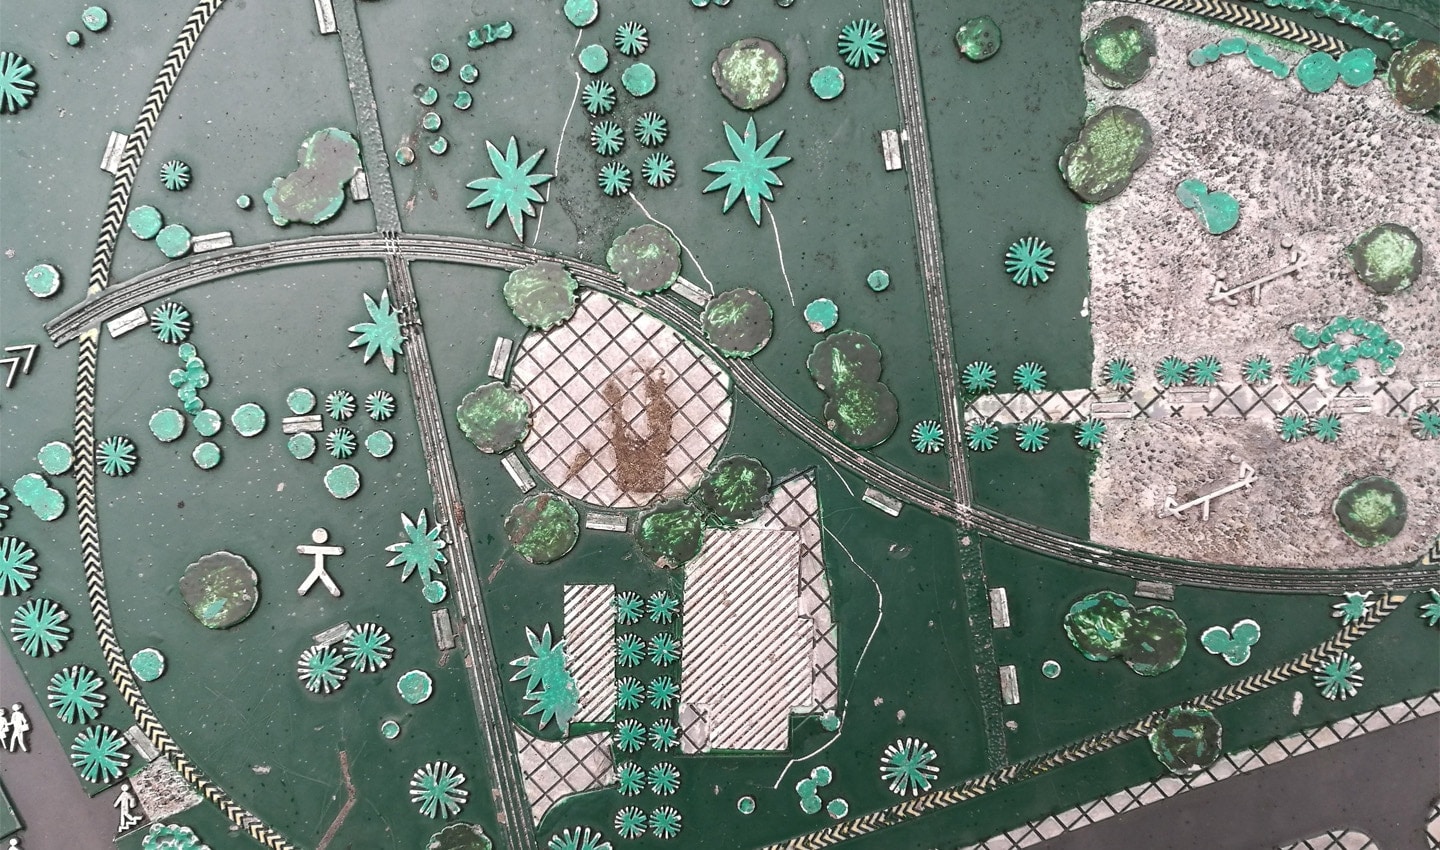
Do Carmo explains there are two main groups of tactile maps. The first, orientation and mobility maps, are primarily aimed at those with visual impairments. The second are geography maps, which are designed to not only provide information about the world but teach students with or without visual impairments about geography. How tactile maps are categorized is based on their purpose, scale and characteristics.
Orientation and mobility tactile maps are extremely beneficial to those not familiar with an area. They are time intensive to create, making them more expensive and less common as a result. Adding on any extra bells and whistles in the way of technology – such as multimedia or auditory add-ons– is even rarer, due to the costly process.
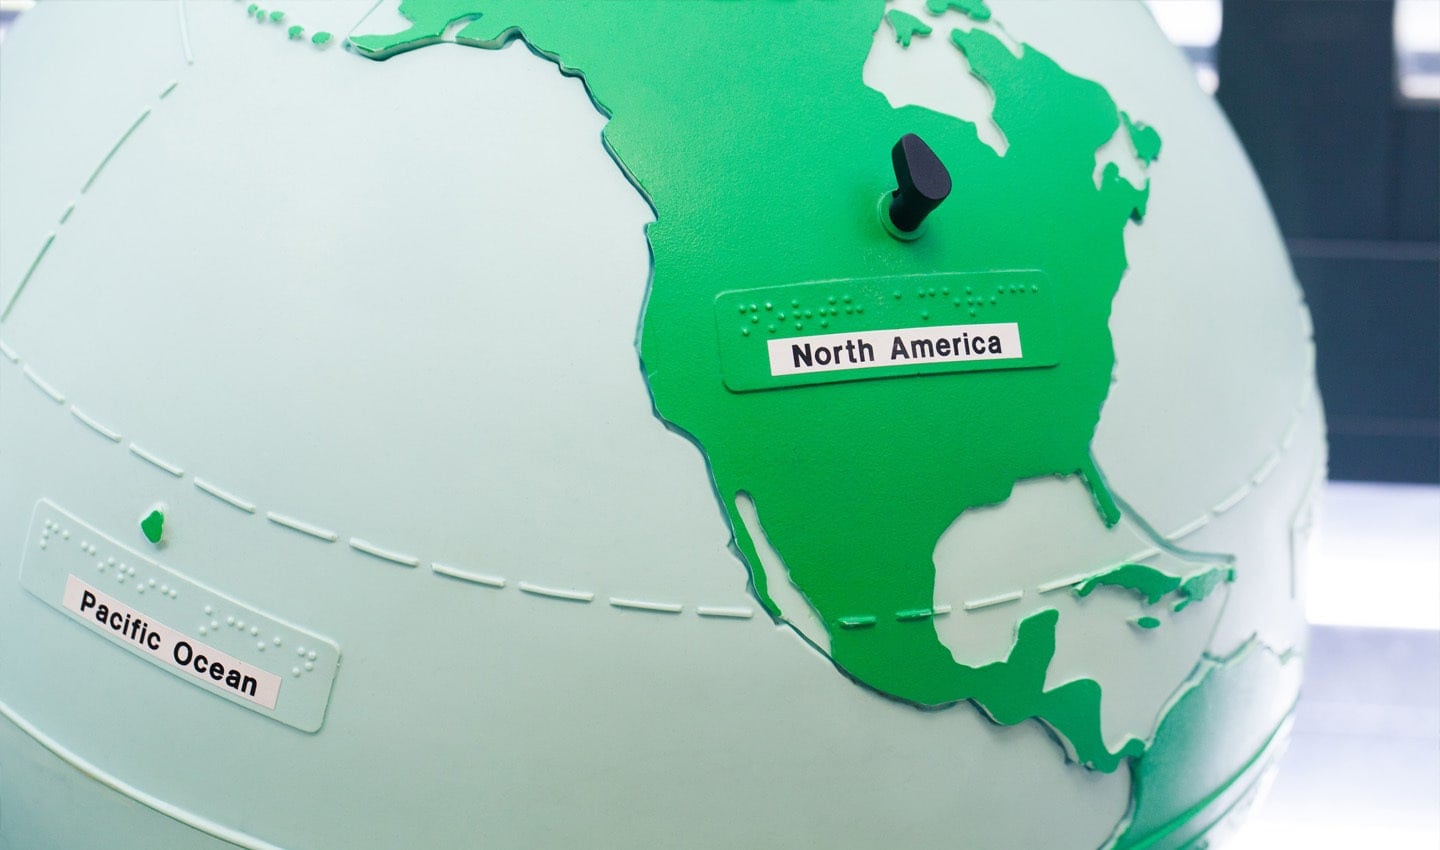
“Many people think tactile mapping is something exclusive to people with visual disabilities, but when tactile language is combined with visual language, using colors and printed letters, these maps can be used by everyone,” do Carmo points out.
Of course, traditional tactile maps can’t just be transferred to a phone screen. In recent years, voice-based interfaces have become more popular, and devices have been invented so that braille can be displayed on electronic surfaces. One such device, the Dot Pad, can generate 300 braille glyphs, and is working on ways to represent depths and slopes on it.
Tactile maps must have a lower level of complexity than other maps, so that users are able to decode map symbols by touch. Height levels need to have a significant amount of difference, so that they can easily be recognized, and if the tactile map is working for guidance of movement it needs to be at a larger scale. This brings a certain amount of difference in how tactile maps are designed – some are designed directly in 3D, while others are drawn in 2D, with relief surface created later in the process.
Captions and text on a tactile map are usually in braille, which can sometimes cause confusion due to braille sizing issues that differ from country to country. Although knowledge of braille amongst visually impaired and blind people is common, there are also those that rely instead on text-to-speech. A combination of both is sometimes used, which affords more widespread use and accessibility for a range of users.
“It is possible to insert sound information, expanding the number of users,” says do Carmo. “For people with visual disabilities, they eliminate a communication barrier and for other students they can mean using a multi-sensory way of learning Cartography and Geography.”
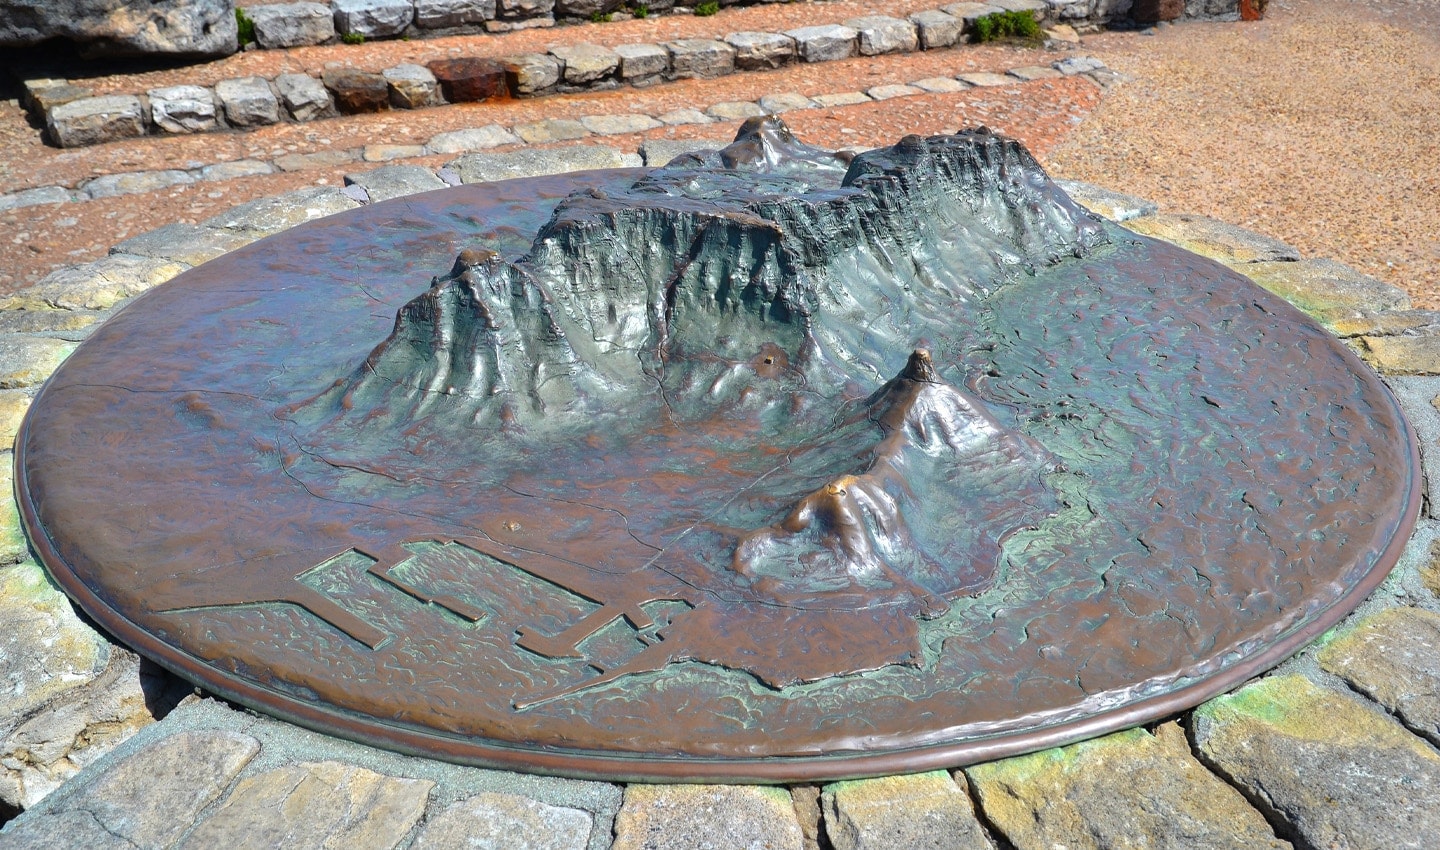
Tactile maps must have a lower level of complexity than other maps, so that users can decode the symbols by touch.
So, how are they made?
“In recent decades, with the development of technology, some materials have emerged to facilitate the elaboration of maps, graphics and relief illustrations,” do Carmo explains. These days, there are a variety of ways to produce a tactile map, from using micro-capsulated paper that can then be printed on before being embossed by a separate machine, to programmable routers that carve the map into wood.
In an interview in the National Braille Press tactile mapmakers explained how they first need to understand the purpose of the map, before they decide who the audience is and how to design it.
“Everything needs to be exact”, said tactile graphic artist and transcriber Colleen Rosenburg. “That’s really the most important part.”
Rosenburg explains her process: called ‘collage’ it consists of using a variety of different materials to create the raised texture unique to tactile maps. Rosenburg names sandpaper, paper dots and string amongst the number of tools she employs. After designing the structure, a specific texture is then glued on to create a raised drawing, which can then be adjusted in height and size, depending on different geographical areas.
Tactile mapping is a careful, specific art. Since tactile maps are vital to those who are visually impaired or blind in their navigation of a certain space, there is no room for mistakes. A blind proofreader is brought in to make sure that everything is in order. Tactile maps can be overwhelming in terms of sensations, and so the need for them to be delineated cleanly is extremely important to their overall accessibility. Once the blind proofreader has given the go ahead, the map is ready to go to production. After being placed in a thermoform machine, a replica of the original model is produced, ready to be used.
This is just one way of creating a tactile map. As do Carmo points out, “Each production method has advantages and limitations and the choice of who will prepare the map depends on a variety of factors such as cost, available technology, number of copies needed and who will be the users of the map”.
Another way of communicating spatial information to blind or visually impaired people is though palm drawing – which is one of the oldest forms of tactile mapping. It’s often used by teachers or those close to the person and can provide a quick and simple overview of what is around that person.
“More recently, rapid prototyping, also known as 3D printing, has been hailed by experts as a revolution in the production of tactile representations,” do Carmo says.
Mapping the future: how tactile mapping is evolving
It’s astonishing, that given how tactile maps are so important to visually impaired people, they aren’t readily available. Tactile maps are expensive and time consuming to make, but they are also a key tool for people around the world.
There is a road ahead, however. New technology is creating opportunities, as well as providing the chance for a greater awareness about the importance of tactile maps. A recent development is ‘zoom maps’, which were designed specifically for braille readers that aren’t well versed in reading tactile graphics.
Zoom maps are meant to work as more of an introductory map, to be used before the person can move onto more complicated maps with advanced tactile graphics. In the manner of online maps, where the person can zoom in on a certain area, zoom maps are hardcopy tactile maps that quite literally zoom in on a new area of the original map on a new page.
The amount of graphic information given aims to be as simple as possible, in order to avoid clutter. As a result, if the information on the page becomes too much, the graphic is then divided and put into a new map with fewer graphics and more specific information. So, the user gets a series of maps, each one focusing on an area in more and more in-depth ways.
Tactile maps are evolving alongside technology, to provide new and better navigational opportunities.
Dr. Joshua Miele, a scientist at the Smith-Kettlewell Eye Research Institute in San Francisco, partnered with LightHouse, an organization for the blind, to create accessible maps of every Bay Area Rapid Transit (BART) station in 2015. Miele’s endeavor to do so was informed not only by his research, but his own experiences of navigating the world in a different way, having lost his sight at the age of four.
The tactile maps Miele and LightHouse created together allow users to use a Livescribe smart-pen to hear out loud information about the space detailed on the map. The maps are tactile, made on an embossing printer and together with its audio-component, create a more technologically advanced tactile map.
Livescribe pens capture everything a person writes – or in this case, tap on, and will then read it out loud. By using these pens on the maps that Miele created, users can click on an icon representing a certain category, and hear more detailed information about that particular subject, from where a ticket booth or exit might be, to how much a certain fare is or what a set of stairs leads to.
This new kind of tactile map also allows users to prepare for their journey, orienting themselves with their surroundings before they visit that station. This is an advantage over traditional tactile maps, as if the tactile map is only readily available in a particular area, the user will be limited to exploring that surrounding without any preparation.
As for do Carmo, technology will lead mapping into new and exciting directions.
“Remote techniques are getting better and better for collecting, processing, saving, representing and updating information,” she says. “Visualization techniques are evolving and expanding, towards virtual realities and 3D images to map geographic space.”
People also read
)
The life of a trucker: What's it like being a professional driver?
)
The Boise boom: How mapmakers keep on top of boomtowns
)
How location data can help emergency responders get to incidents quicker and save more lives
* Required field. By submitting your contact details to TomTom, you agree that we can contact you about marketing offers, newsletters, or to invite you to webinars and events. We could further personalize the content that you receive via cookies. You can unsubscribe at any time by the link included in our emails. Review our privacy policy. You can also browse our newsletter archive here.