When cities move,
our world moves forward.
The way cities move reflects our changing world. With mobility data from more than 500 cities across six continents, the TomTom Traffic Index captures how people, goods and ideas flow globally. It provides cities with insights to become more livable, sustainable and efficient, transforming them into thriving urban environments that move with purpose and accelerate.
London was the slowest city in Europe in 2024
It takes the average driver, on the average day, just over 33 minutes to drive 10 km. That’s an average speed of 18 kmph (11.2 mph). Compared to when traffic is free flowing, it equates to a delay of about 8 minutes per trip
This all adds up. Based on these averages, drivers in London lose 46 minutes per day due to congested rush hour traffic.
New York was the slowest city of 2024 in the U.S.
Compared to the rest of the globe, the travel times drivers experience in the American metropolis see it rank 25th in the world.
Sapporo, Japan experiences the worst day of traffic in 2024
When traffic is running smoothly, drivers can complete a 10 km trip in under 23 minutes in Hokkaido’s largest city. In average traffic, that journey would take about 30 and a half minutes. Sapporo ranks 29th globally, based on travel times.
| Rank by filter | World rank | City | Average travel time per 10 km | Change from 2023 | Congestion level % | Time lost per year at rush hours | Congestion world rank |
| 11 Barranquilla 36 min 6 s- 20 s 45%130 hours16 | |||||||
| 22 Kolkata 34 min 33 s+ 10 s 32%110 hours173 | |||||||
| 33 Bengaluru 34 min 10 s+ 50 s 38%117 hours65 | |||||||
| 44 Pune 33 min 22 s- 1 min 34%108 hours127 | |||||||
| 55 London 33 min 17 s+ 40 s 32%113 hours150 | |||||||
| 66 Kyoto 33 min 16 s+ 20 s 39%95 hours60 | |||||||
| 77 Lima 33 min 12 s+ 1 min 30 s 47%155 hours9 | |||||||
| 88 Davao City 32 min 59 s- 30 s 49%136 hours3 | |||||||
| 99 Trujillo 32 min 56 s+ 30 s 34%102 hours117 | |||||||
| 1010 Dublin 32 min 45 s+ 40 s 47%155 hours10 |

Traffic Analytics
TomTom Move
Get the insights you need to manage traffic, improve mobility and make location-informed decisions.
Smarter Cities
Public Sector & Governments
Enhance citizen safety or support sustainable urban growth, TomTom empowers governments to make smarter, data-driven decisions while maintaining privacy.
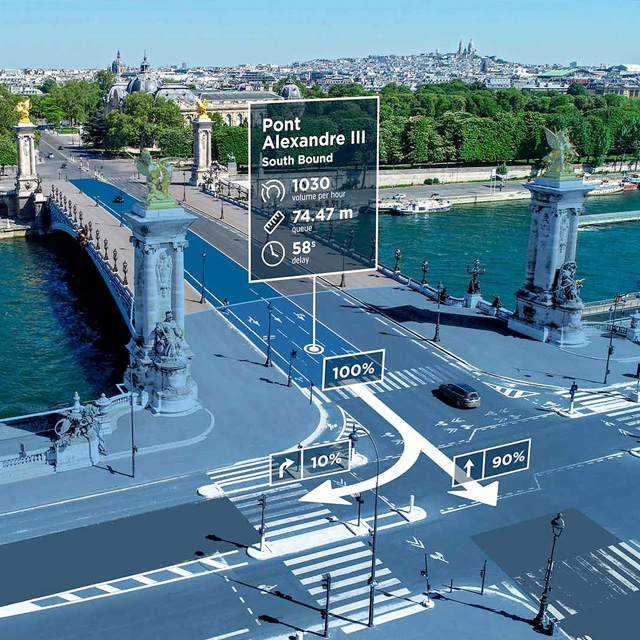
Analyse intersections
Junction Analytics
TomTom Junction Analytics helps road authorities, traffic managers and engineers monitor and improve traffic light performance, making roads safer, greener and less congested.
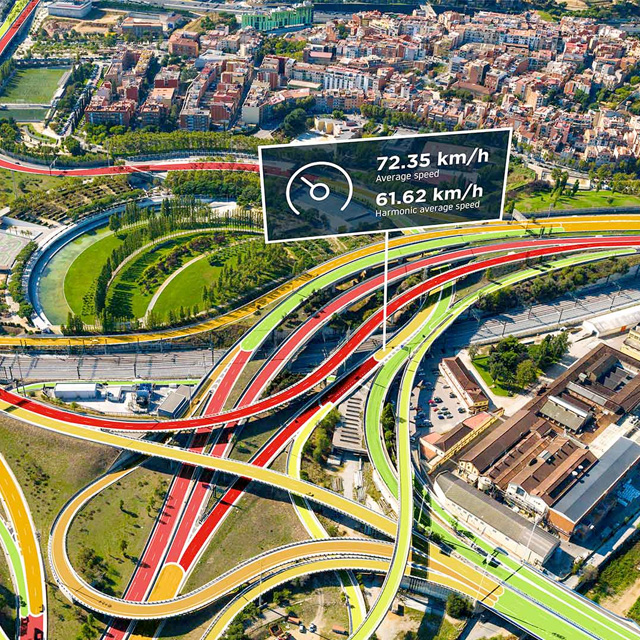
Find bottlenecks
Traffic Stats
With years of data on road speeds, travel times and traffic density, TomTom Traffic Stats give you the insights you need to understand, predict and reduce congestion.
Calling all city planners, automakers and policy makers – let’s change the way the world moves.