Can emerging traffic patterns reveal coronavirus implications?
&w=256&q=90)
Are we heading for a boom or recession? Can we forecast the sales of new cars? How are commodities performing on the world market? What is happening to population trends? The answers to these questions might lie in analyzing emerging traffic patterns.
Knowledge is power and measuring is knowing. Analysts are always looking for clues as to how areas of the economy are performing. It gives them an advantage for providing an analysis of current trends, or the demand for certain commodities.
The type of questions they want an answer to are, are we heading for a boom or recession? Can we forecast the sales of new cars? How are commodities performing on the world market? What is happening to population trends?
The problem they face is gaining access to timely, relevant and up-to-date information. The traditional method of looking at survey or census data, or sales records, is that it is invariably out-of-date before it can be of any use.
Having access to an instant source of information provides a snapshot of current trends. Hour by hour data comparisons provide micro levels of data analysis which, aided by the latest computer algorithms, can map the way the world works in minute detail.
This level of granular information is vital for almost all sorts of data intelligence teams; for banks, retailers, town planners, governments, marketing teams or the media.
The power of traffic data
At TomTom, we track real-life traffic patterns. Millions of motorists use our data every minute of every day. It provides an analysis of up to 80% of traffic movements across the globe. It’s updated every 15 minutes and can provide them with the traffic insights they need to make informed decisions.
Over the years we have seen that traffic congestion levels are closely related to economic activity levels: the more jobs there are, the more trips there are made to and from work and the more income people have for other activities that generate even more trips.
The outbreak
The coronavirus outbreak threw the value of our data into a stark reality. The shutdown of factories and businesses in China had a massive impact on social patterns. Overnight, the mass volumes of traffic disappeared from the roads and cities.
It was picked up instantly in our Traffic Index. Now running for its ninth year, the TomTom Traffic Index provides a city-by-city analysis of the trends and traffic patterns in cities across the world. It is normally used to track traffic congestion patterns and how busy our cities are, on a 48-hour and weekly basis.
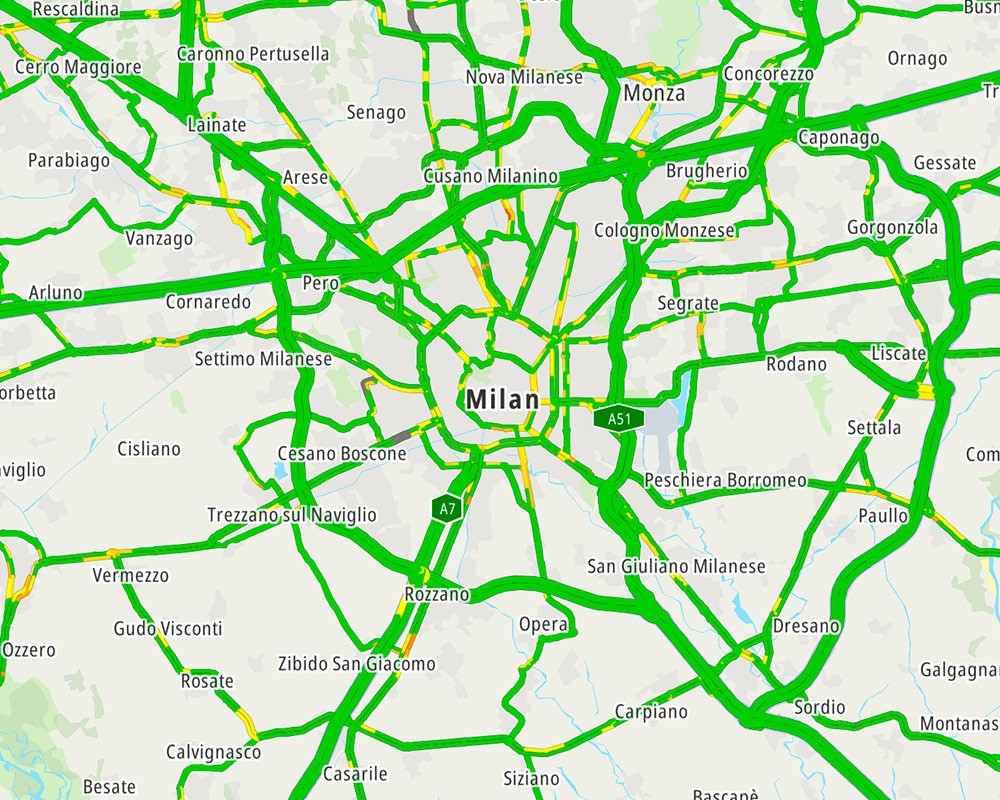
Now, in complete contrast, the Traffic Index is showing how empty our roads are. This was first visible in cities in China. Some cities, notably Milan, have shown decreases of more than 85% on their normal traffic activity levels. Understandably, it was big news, covered by media outlets around the world. But it’s also a vital sign for traders and financial institutions, who are looking for clues for upticks in economic activity.
Traders look for clues
Finding a profit in the commodity market is a fine balancing act. Traders’ traditional sources of information are no longer available due to travel banks or coronavirus restrictions. Instead, they are looking at data from sales from the petrol pumps or scouring social media to see what is ‘trending’. But there is nothing that is more accurate than traffic flows. Real-time information can provide an instant snapshot of when the economy starts to move again, and when demand for oil and petrol begin an upward trajectory.
What is happening in Italy?
We used the TomTom traffic data to track the movement in Italy, as one of the biggest impacted countries in Europe at the time. We focused heavily on the north of the country, where the areas most impacted by the virus are. As you can see from the diagrams, TomTom indicated a huge decrease in traffic in the key regions of the country as the country responded to the shutdown.
When comparing March 2020 to February 2020, we saw a decrease in traffic of up to 63% between Codogno and Casalpusterlengo. Traffic flows also decreased by up to 72% on the road network surrounding Bergamo.
When comparing March 2020 to March 2019, the traffic to and from airports in Lombardy reduced heavily – by as much as 80%.
Public health
The coronavirus lockdown has huge implications for public health. Countries around the world are taking different approaches, from the total lockdown in China, the rapid response in Italy, to the more laissez faire approach of countries like Sweden or Norway.
Media scrutiny
Traffic trends are being closely monitored by the world media. How does the approach in the UK impact the spread of the virus? Is the population of a country taking heed of its government’s instructions not to travel? How effective is the shutdown in certain cities or certain regions?
The data has massive implications for public health measures. Gaining access to real-time information provides immense benefits to health professionals, city planners and government advisers. John Burn-Murdoch in the Financial Times reported that Londoners were failing to curb their love of the car, despite the new restrictions, based on TomTom’s real-time traffic data.
TomTom can provide real-time data to show how traffic is impacting certain areas. It is no surprise to discover, for instance, that traffic speeds around London in the UK have substantially increased since traffic decreased. The image below shows that, in peak rush hour (between 8am and 9am), between October 2019 and March 2020, harmonic (average) speeds increased by 140%.
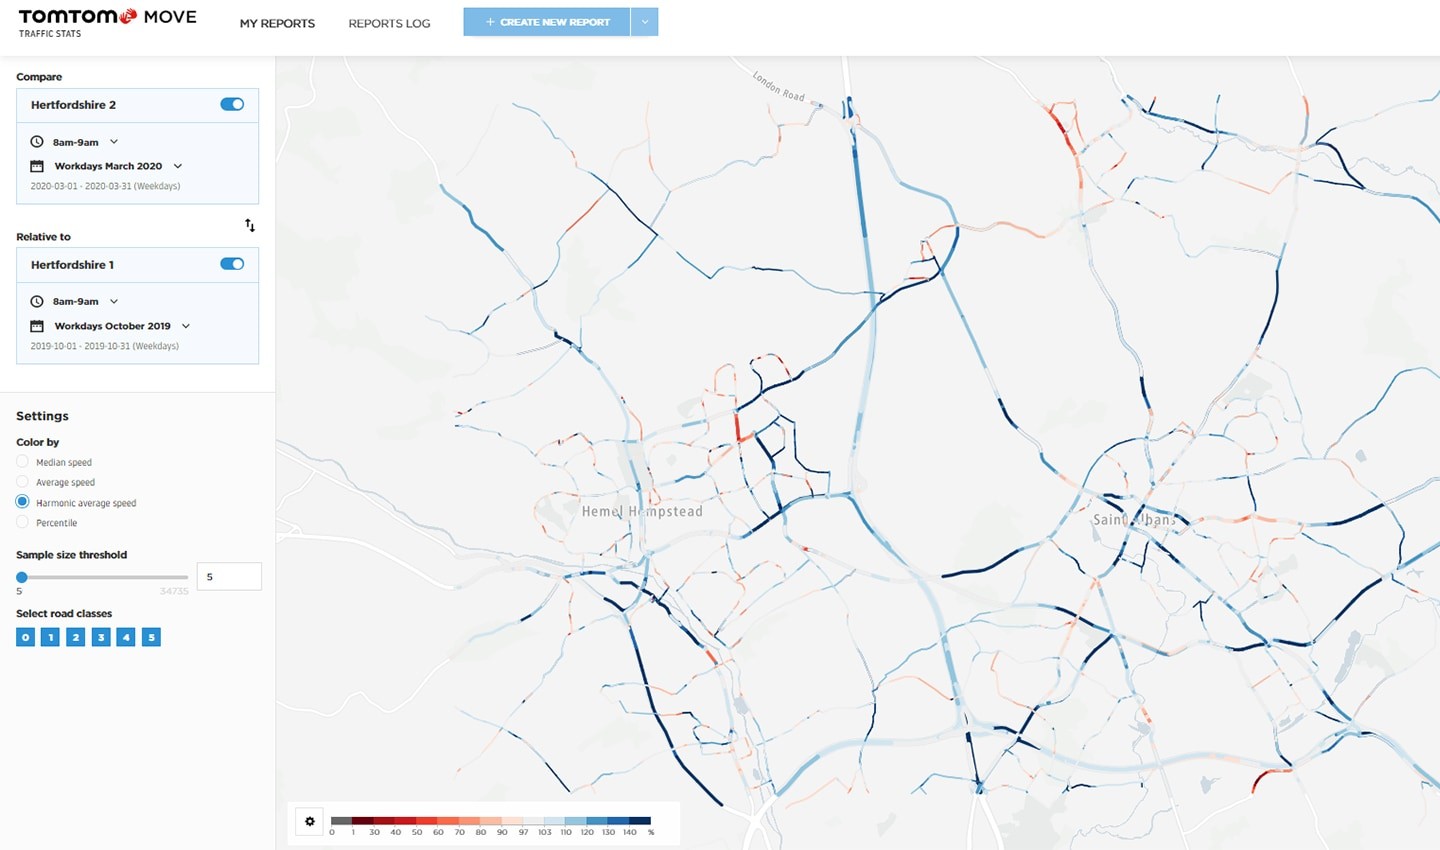 Traffic comparison for Hemel Hempstead and the surrounding area, including part of the M25. In the key, the colors represent the percentages of October 2019 speed measured in March 2020 – the dark blue patches show the improved speeds.
This is invaluable information for road planners to plan potential traffic flows when impacted by road works, or for emergency services to anticipate response times in certain areas of the country.
Anonymized traffic data
All the data used by TomTom is anonymized and belongs to the driver. It is never used to identify individual journeys or track start and end positions. That way, the driver stays in control of the information about them. We do, however, use the data to improve the way we develop products and information about journeys and what happens on them.
If, for instance, a stretch of road is empty for a certain period, we can check to see whether it is still open. If there is an area where we don’t have information on a new road route, but the traffic data says otherwise, we’ll see if there has been fresh construction work.
Planning for normality
We’re all looking forward to a post-coronavirus world, where traffic gets back to some kind of normality. We know that economists will be looking keenly at the data for indications when parts of the world start ‘working’ again. They’ll be looking at the volumes of traffic as indicators of when and where businesses are starting up as normal.
For a business, traffic data is crucial for their day-to-day operations. They can use it for all sorts of marketing information, or to plan their logistics operations. It’s useful for all sorts of things, not just in these extraordinary times. Let’s hope that business does indeed get back on its feet quickly and smoothly, and we can all enjoy the freedom of the roads once again…
The motor industry
Many companies use motoring data to plan their business operations. The motor dealer can see where the biggest traffic flows are, for instance. They can plan their showrooms where the most passing traffic is likely to flow. It can be used to plan new petrol stations or electric charging installations. Or manufacturers can view the data to see what the average car usage patterns are like, to judge when breakdowns may occur or the frequency between service levels. It all pays to plan ahead, and utilizing data patterns is the perfect way to do it.
Track the coronavirus through traffic
If you want to use traffic data to help you assess the impact of the coronavirus, reach out. We’re happy to help.
People also read
)
What can traffic data tell us about the impact of the coronavirus?
)
Traffic data: The key to effective road traffic management
)
The TomTom Traffic Index: An objective measure of urban traffic congestion
* Required field. By submitting your contact details to TomTom, you agree that we can contact you about marketing offers, newsletters, or to invite you to webinars and events. We could further personalize the content that you receive via cookies. You can unsubscribe at any time by the link included in our emails. Review our privacy policy.